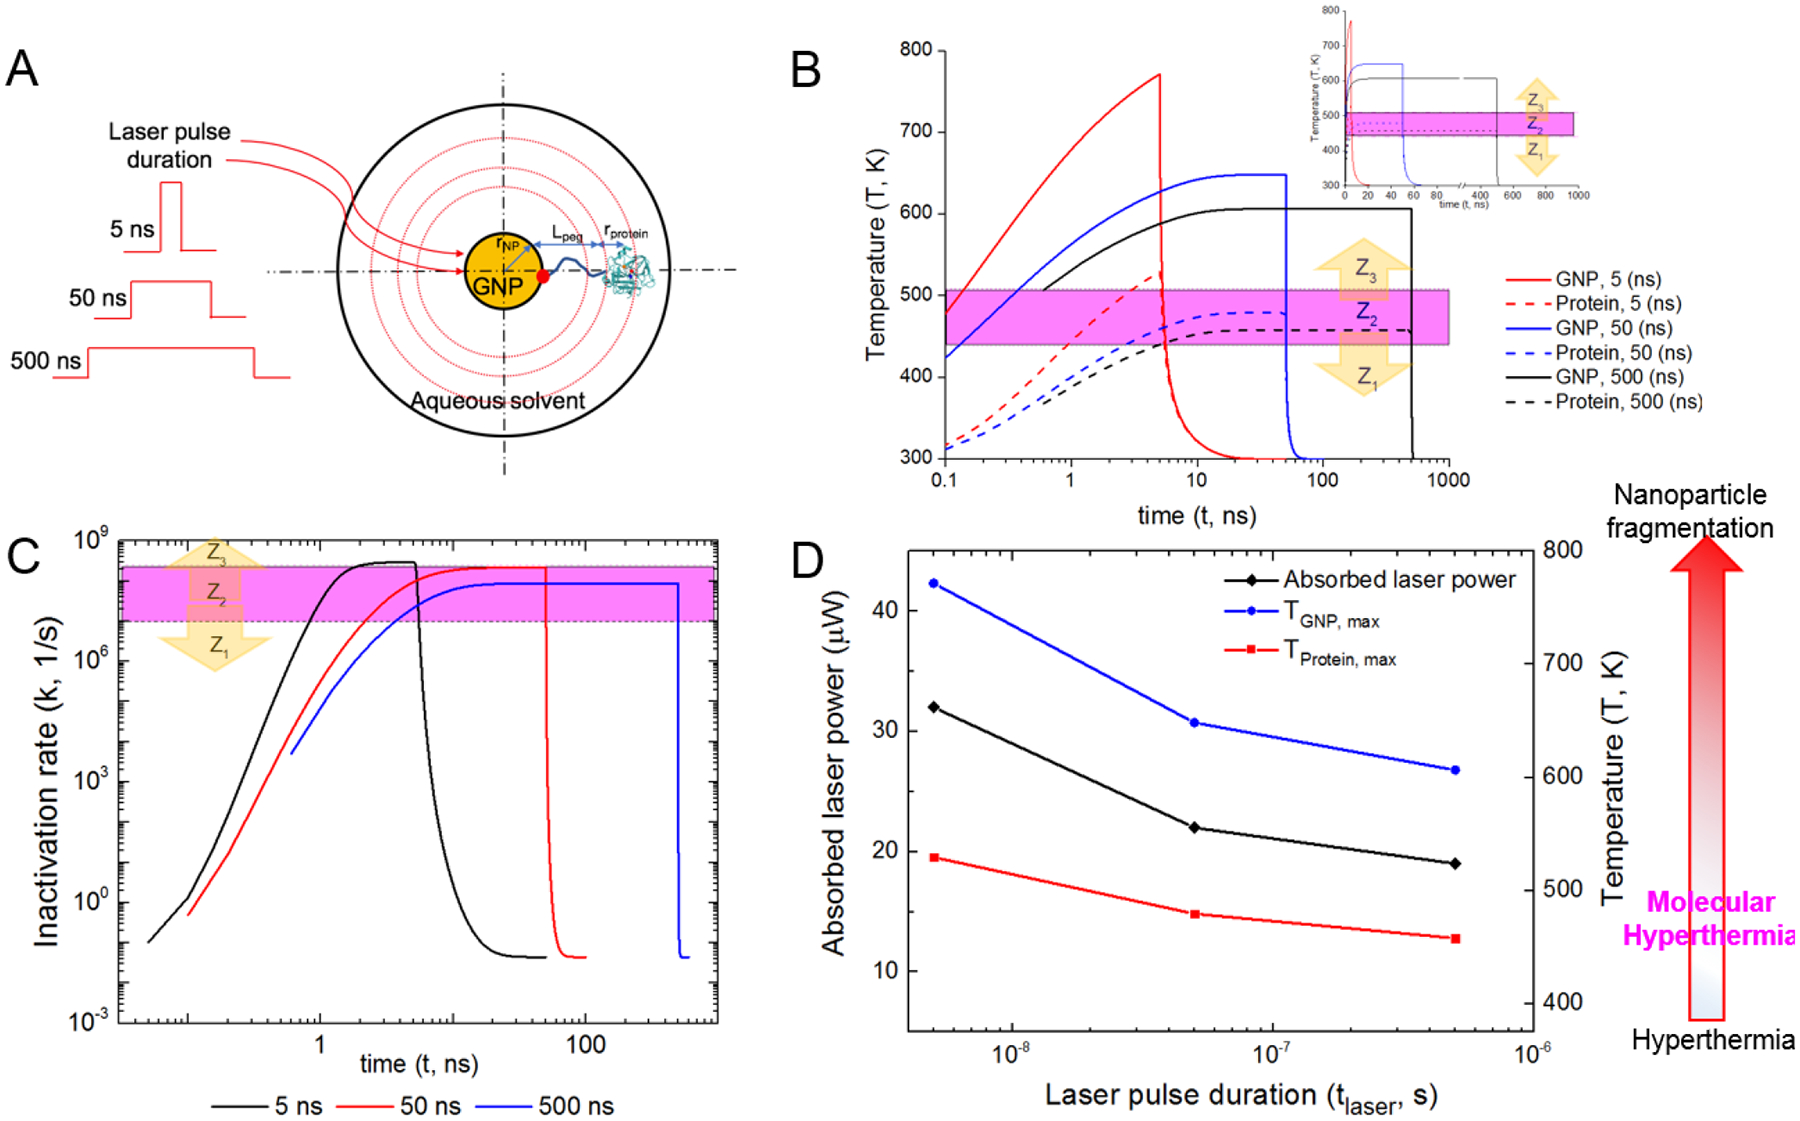
Figure 6:

Optimizing the ultrashort timescale for molecular hyperthermia. (A) Schematic represents molecular hyperthermia at different laser pulse durations (5 ns, 50 ns and 500 ns). (B) Local temperature histories at the protein center and GNP surface (15 nm). All cases give the same impact zone of 10 nm. Inset shows the temperature profile with linear x-axis. (C) Protein inactivation rate calculated using the reaction-diffusion model and temperature history in (B). (D) Absorbed laser power in GNP and maximum temperatures of protein and GNP at different pulse durations.
