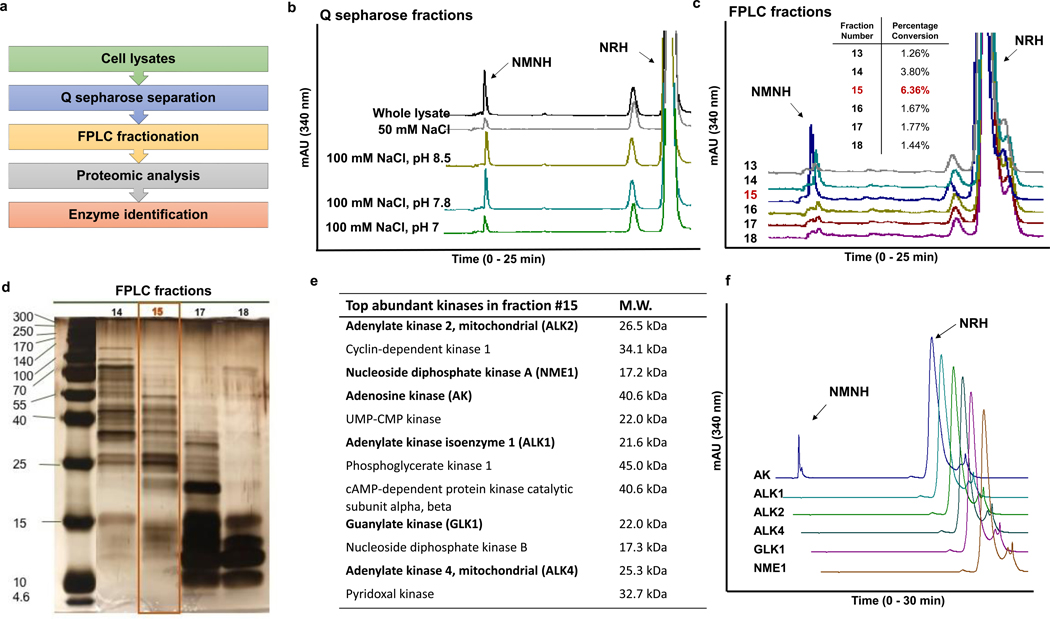
Figure 2.
Identification of the NRH kinase. a) Scheme of enzyme identification procedures. b) Activities of NRH kinase active fractions from Q sepharose-separated Neuro2a lysate. Experiments were repeated independently 3 times with similar results. c) To identify the fraction with highest NMNH converting ability, equal volume of eluants from FPLC separation (See text for more information) were incubated with 2 mM NRH, 2 mM ATP/Mg2+ in pH 8.5 phosphate buffer at 37°C for 30 min and the product NMNH was quantified on HPLC. Percentage conversion was calculated by the area-under-curve quantification of NMNH peak divided by the sum of NMNH and NRH peak areas at 340 nm. Experiments were repeated independently 3 times with similar results. d) Silver-staining of SDS-PAGE gel of fraction 15 and adjacent fractions from FPLC separation shows size distribution and relative abundance of proteins. e) Proteomics-assisted analysis reveals the most abundant kinases from the top 200 abundant enzymes in fraction 15. Bolded enzymes were selected for testing. f) NMNH forming activities of the candidate kinases (0.25 μg enzyme incubated with 2 mM NRH, 2 mM ATP/Mg2+ in pH 8.5 phosphate buffer at 37°C for 30 min). Experiments were repeated independently 3 times with similar results. Controls for positive activities of kinases are in Figure S3.

