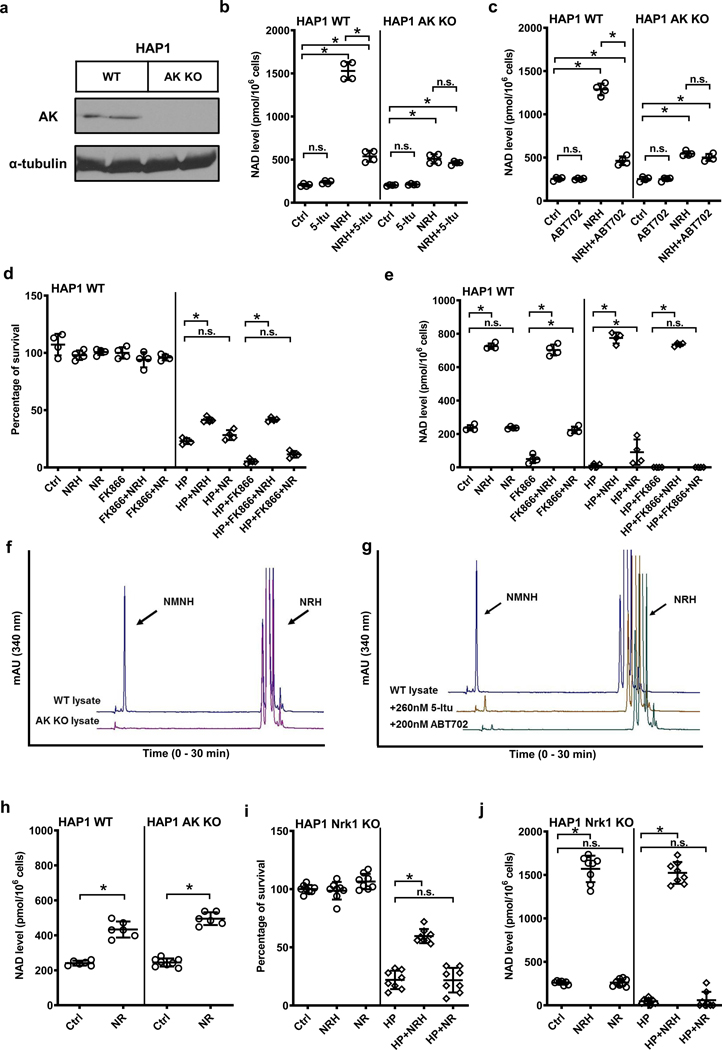
Figure 5.
HAP1 AK KO cells lack NRH kinase activity. a) HAP1 AK KO cells lose AK protein expression. Experiments were repeated independently 2 times with similar results. b) & c) 1 mM NRH raises NAD+ levels in wildtype HAP1 cells, and the increase is abolished with AK inhibitors 5-Itu (26 nM) or ABT702 (20 nM). AK KO cells have significantly diminished NRH-induced NAD+ enhancement as compared to wildtype, 5-Itu or ABT702 have not further reduced NAD+ levels in NRH-treated AK KO cells. Data expressed as mean ± SD, n=4 biologically independent samples. *, p<0.0001. d) & e) 250 μM NRH protects wildtype HAP1 cells from 500 μM HP-induced cytotoxicity shown by increased survival (d), correlated to increase of NAD+ levels (e), whereas NR at the same concentration does not significantly improve survival with minimal NAD+ preservation against HP. Nampt inhibitor FK866 (400 nM) further reduces NAD+ concentration in cells and aggravates cell death upon HP treatment, without interfering with cell rescuing effect of NRH. Data expressed as mean ± SD, n=4 biologically independent samples. *, p<0.0001. f) NRH kinase activity can be detected in wildtype HAP1 cell lysate, but not in HAP1 AK KO lysates. g) HAP1 WT lysate NRH kinase activity can be inhibited with 5-Itu or ABT702. For f) & g) experiments were repeated independently 3 times with similar results. h) HAP1 AK KO cells do not interfere with NR activity as 1 mM NR raised NAD+ concentration by 2-fold in both HAP1 WT and AK KO cells. Data expressed as mean ± SD, n=6 biologically independent samples. *, p<0.001. i) & j) NRH effect does not require Nrk1 activity, as 1 mM NRH protects HAP1 Nrk1 KO cells from 500 μM HP-induced cell death (i) by elevating cellular NAD+ levels (j), whereas 1 mM NR fails to rescue cells and NAD+ concentrations in HAP1 Nrk1 KO cells. Data expressed as mean ± SD, n=8 biologically independent samples. *, p<0.0001. For b) to e), i) & j), one-way ANOVA and Tukey’s multiple comparison test were used for statistical analysis; for h) unpaired t-test was used.

