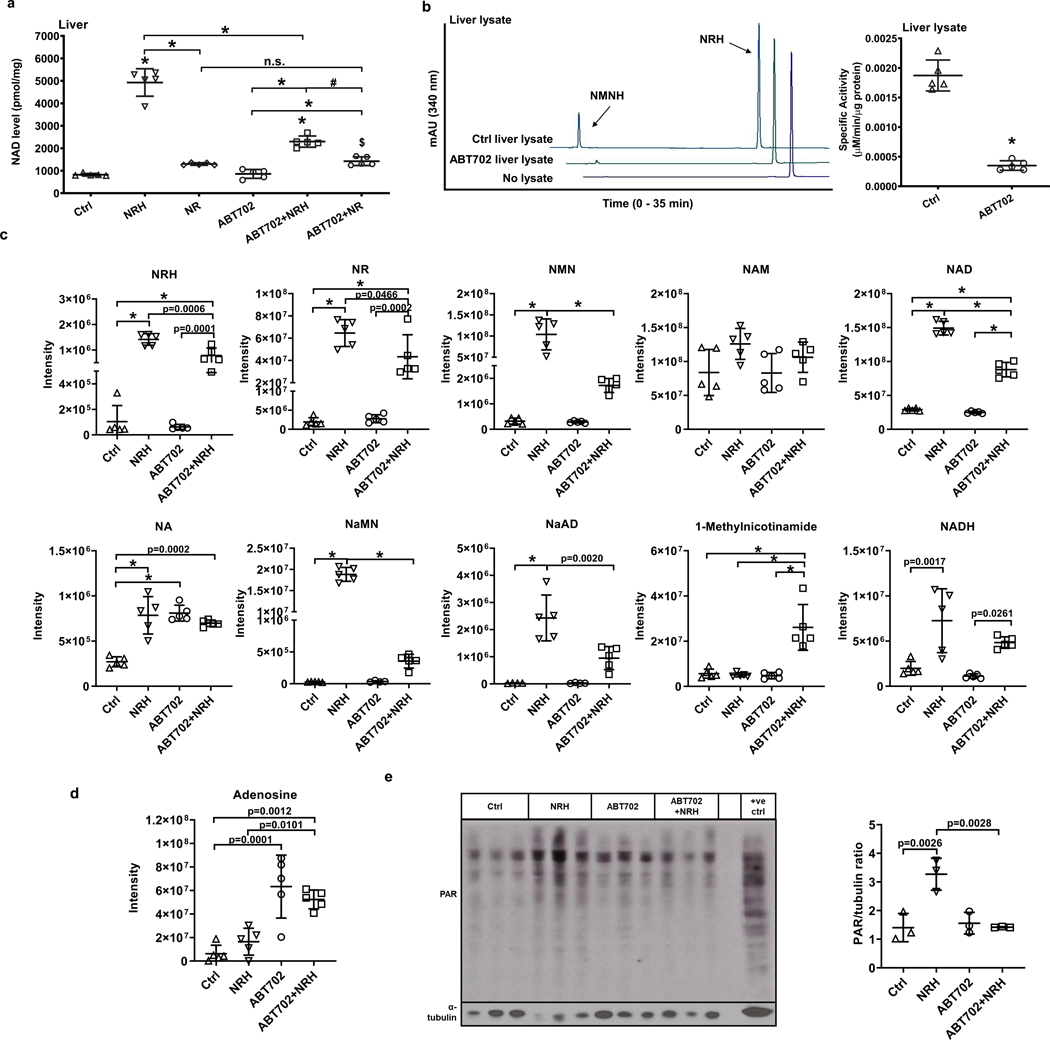
Figure 8.
AK inhibitor antagonizes NRH impacts in mouse liver. Adult male C57BL/6N mice (n = 5) received 250 mg/kg NRH or NR with or without 3 mg/kg ABT702 through IP injection, and sacrificed after 2 hr. a) NAD+ concentrations in mice livers measured by cycling assay. Data expressed as mean±SD, n=5 animals. $, p= 0.0371 in Ctrl vs. ABT702+NR; #, p=0.0011 in ABT702+NRH vs. ABT702+NR; *, p<0.0001 when compared to control or within indicated groups through one-way ANOVA and Tukey’s multiple comparison test. b) Protein lysates from Control and ABT702 treated livers were extracted and 30 μg of protein were incubated with 1 mM NRH, 1 mM ATP/Mg2+ in pH 8.5 phosphate buffer at 37°C for 30 min. Left panel shows representative HPLC chromatograms at 340 nm, right panel shows the quantification of NMNH producing specific activities of the protein lysates. Data expressed as mean±SD, n=5 animals. *, p<0.0001 through unpaired t-test analysis. c) Metabolomic analyses of nicotinamide derivative compounds in livers of control and NRH groups with or without ABT702 treatment. d) Mass-spectrum intensity of adenosine in mice livers of control and NRH groups with or without ABT702 treatment. Data expressed as mean±SD, n=5 animals. p values have either been specified or labeled with * if p<0.0001 when compared to control or within indicated groups through one-way ANOVA and Tukey’s multiple comparison test. e) Western blot of ADP-ribosylation in livers of control or NRH treated groups with or without ABT702 indicating activation of downstream NAD+ signaling. Positive control (+ve ctl) is defined in Reporting Summary. Right panel shows densitometry of the total ADP-ribosylation over α-tubulin. Data expressed as mean±SD, n=3 animals.

