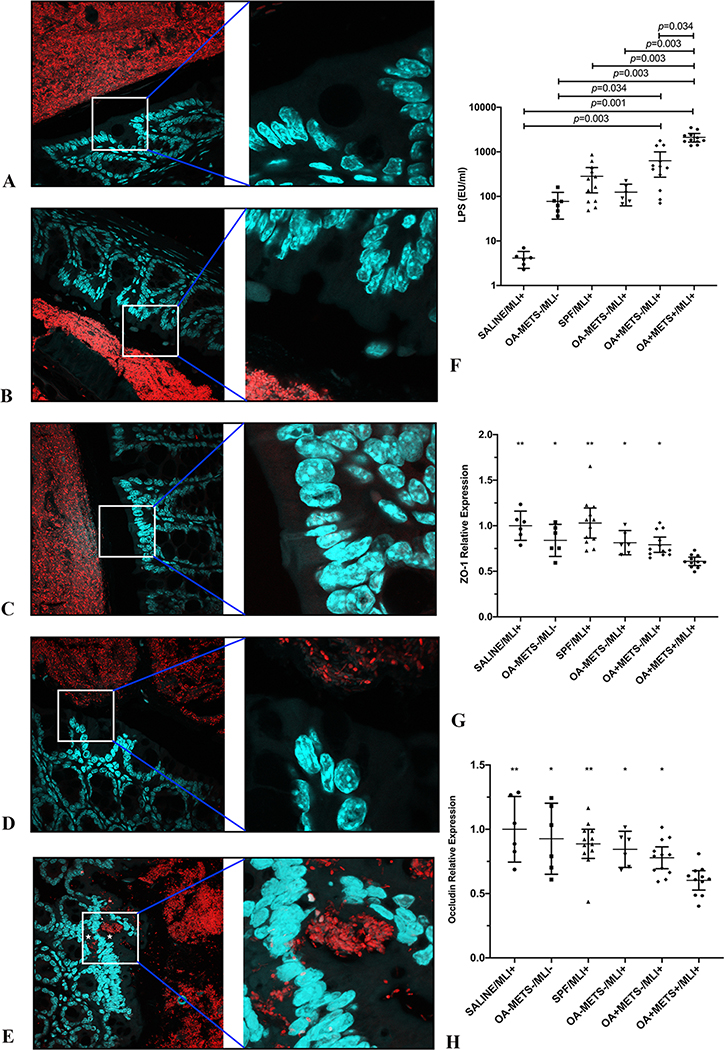
Figure 4. Germ-free mice transplanted with fecal samples from patients of OA with metabolic syndrome showed increased gut permeability.
(A-E) Representative images of gut barrier visualized by FISH (16S rRNA genes of all bacteria [red] and nuclei [green]) (left panels original magnification: ×60; right panels original magnification: ×240). Bacteria invasion into colonic mucosa was captured in mice from the OA+METS+/MLI+ group (E) (marked by asterisk). No signs of bacteria invasion were observed in mice from the SPF/MLI+ (A), OA-METS-/MLI- (B), OA-METS-/MLI+ (C), OA+METS-/MLI+ (D) groups. (F) Significantly increased systemic plasma LPS levels were observed in mice from the OA+METS+/MLI+ group. (G) Significantly decreased mRNA level of tight junction protein ZO-1 was observed in mice from the OA+METS+/MLI+ group, compared with mice from the SALINE/MLI+ (p<0.01), SPF/MLI+ (p<0.01), OA-METS-/MLI- (p=0.036), OA-METS-/MLI+ (p=0.036) and OA+METS-/MLI+ (p=0.036) groups. (H) Significantly increased mRNA level of tight junction protein Occludin was preserved in mice from the SALINE/MLI+ (p<0.01), SPF/MLI+ (p<0.01), OA-METS-/MLI- (p=0.02), OA-METS-/MLI+ (p=0.034) and OA+METS-/MLI+ (p=0.048) groups, compared with those from the OA+METS+/MLI+ group. ** stands for p<0.01, * stands for 0.01≤p<0.05. Data were compared by the Kruskal-Wallis test, multiple comparison p values were adjusted by the Benjamini-Hochberg procedure. Each bar represents a group (x-axis) with mean and 95% confidence interval (y-axis). (OA=Osteoarthritis; METS=Metabolic Syndrome; MLI=Meniscal/Ligamentous Injury)

