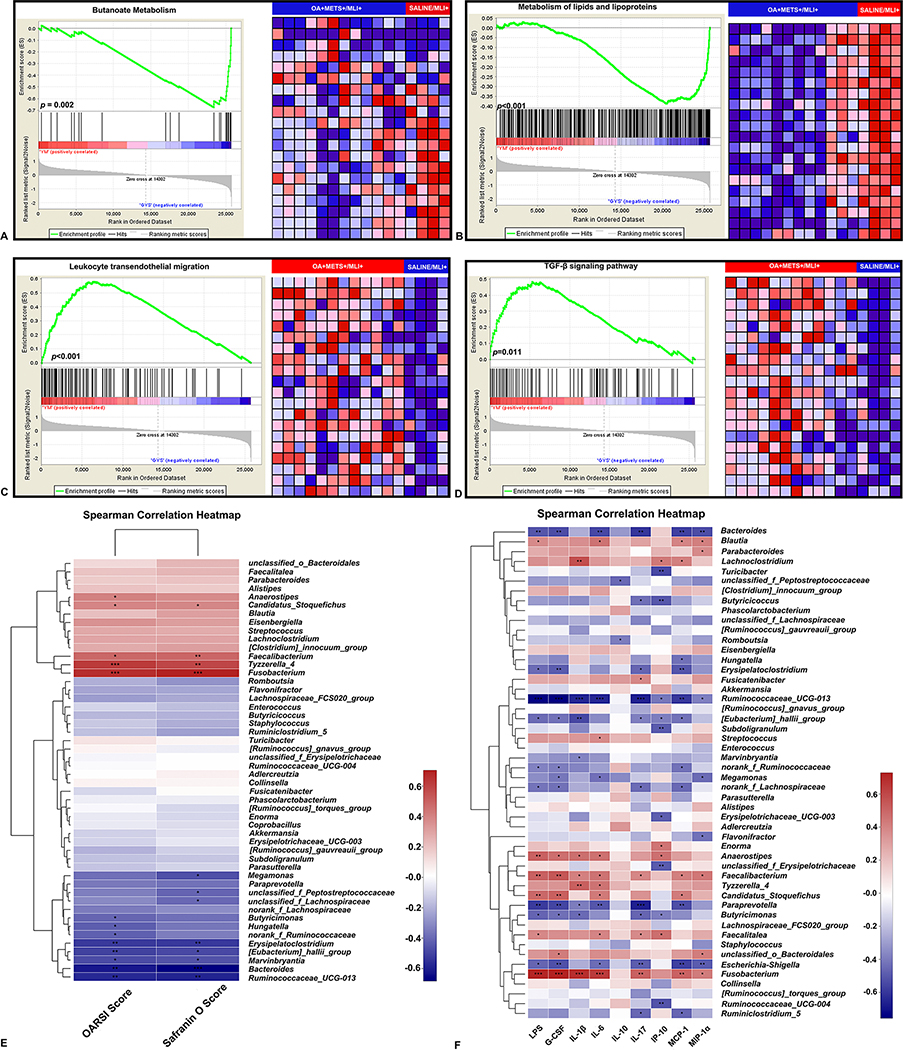
Figure 5.
Gene set enrichment analysis (GSEA) of the RNA sequencing data of peritoneal fat tissue between OA+METS+/MLI+ VS. SALINE/MLI+ mice (A-D). (A) GSEA for butanoate metabolism. (B) GSEA for metabolism of lipids and lipoproteins. (C) GSEA for leukocyte transendothelial migration. (D) GSEA for TGF-β signaling pathway. The enrichment plot on the left of each panel shows the distribution of genes in the set that is correlated with the SALINE/MLI+ or OA+METS+/MLI+ groups. The heatmap on the right of each panel shows where gene expression is relatively high (red) or low (blue) for each gene in the indicated sample. Correlation between gut bacterial genera, cartilage histology scores and inflammatory biomarkers (E-F). (E) Correlations between abundance of bacterial genera and cartilage histology scores. (F) Correlations between the abundance of bacterial genera and inflammatory biomarkers. ** stands for p<0.01, * stands for 0.01≤p<0.05. Positive correlation-red, negative correlation-green. Spearman correlations were performed. (OA=Osteoarthritis; METS=Metabolic Syndrome; MLI=Meniscal/Ligamentous Injury)

