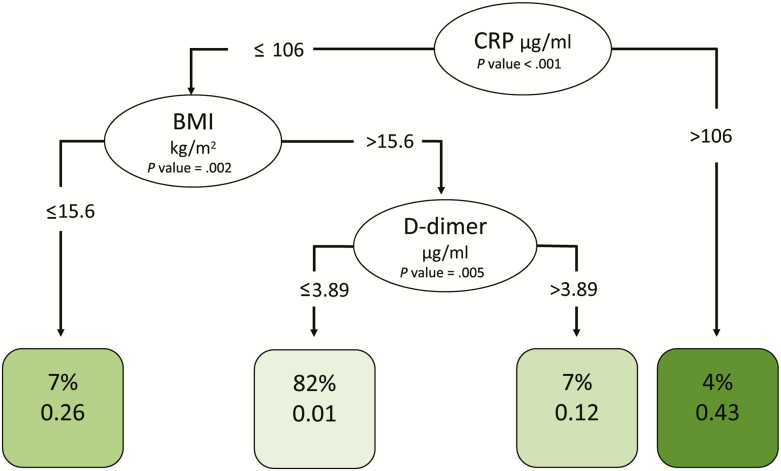
Figure 5.
Decision tree analysis for predicting death. To create the conditional inference tree for predicting death, we used 10 baseline biomarkers (BMI, CD4 and CD8 T-cell counts, human immunodeficiency virus RNA, hemoglobin, white blood cell count, platelets, glucose, D-dimer, and CRP) and site, using the R party package (version 3.5). Potential splits are included in the tree model if they met a Bonferroni-adjusted threshold for statistical significance. Ovals indicate a split in the prediction rule on a specific variable, along with the corresponding P value. Each square shows the percentage of observations within that branch that met the decisional criteria followed by the proportion of those patients who subsequently died. The shading of the squares indicates the proportion of patients who died, with darker shading indicating the highest proportion. Abbreviations: BMI, body mass index; CRP, C-reactive protein.

