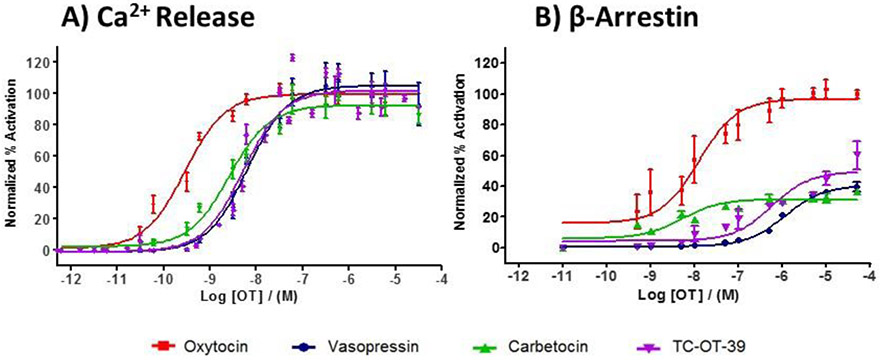
Figure 1. Dose response curves for oxytocin, vasopressin, carbetocin, and TC-OT-39 in Ca2+ release and β-arrestin recruitment assays.
A) Activity of agonists in a Gq-coupled Ca2+ release assay using CHO cells stably expressing hOXTR. B) Activity of agonists in the PathHunter™ eXpress β-Arrestin GPCR Kit using the PathHunter™ OTR eXpress cell line.

