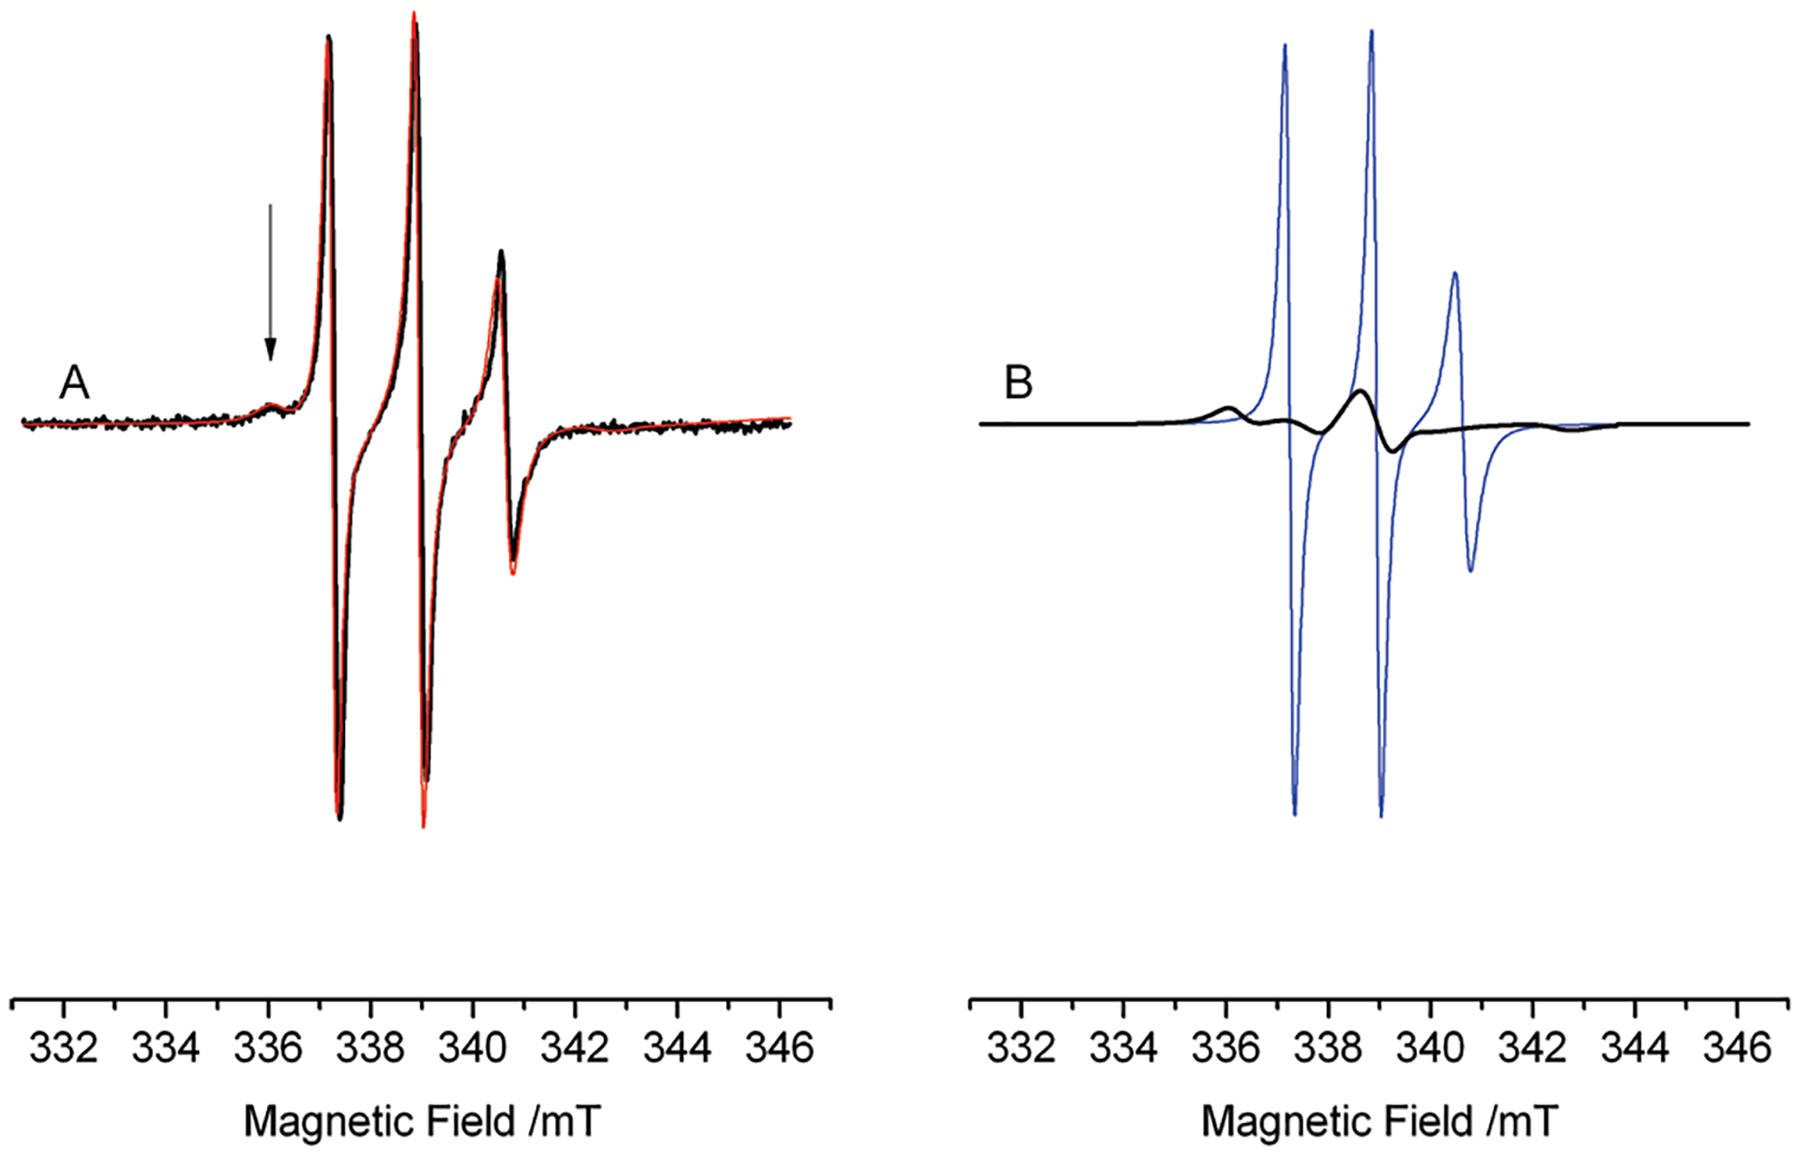
Figure 4.

(A) EPR spectrum of the ternary complex (Figure 3D), together with its simulation (thin red line) obtained as a sum of a component arising from 9 in the ternary complex (40%) and a component arising from 9 free in solution (60%). (B) Individual components of the simulation in (A): 9 free in solution (thin blue line) and in the ternary complex (thick black line).
