
Fig. 1. Association between Intracellular and Plasma Concentrations of Imatinib.
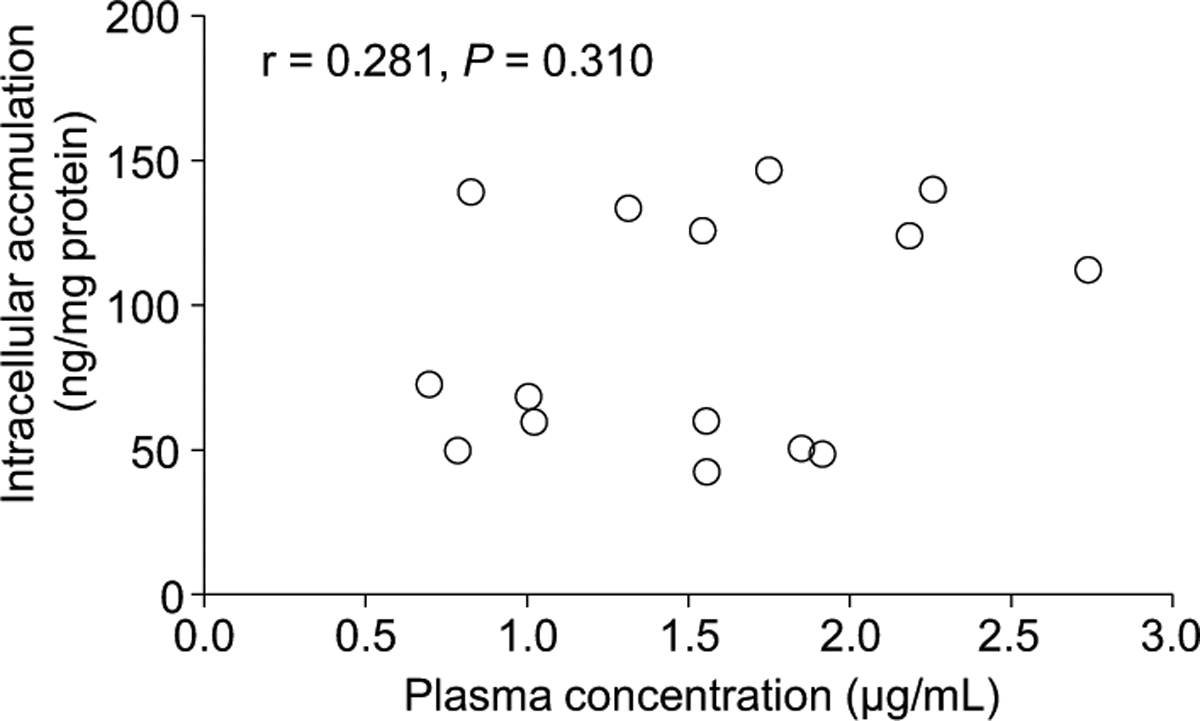
Each point represents the mean value of individual patients. There was no correlation between the intracellular and plasma concentrations of imatinib in patients with CML (r=0.281, p=0.310). Correlations between intracellular and plasma concentration were analyzed using Pearson’s correlation coefficient test.