
Fig. 2. Association between Clinical Response and the Intracellular Concentrations (A), the Plasma Concentration (B), and the Intracellular to Plasma Concentration Ratio (C) of Imatinib.
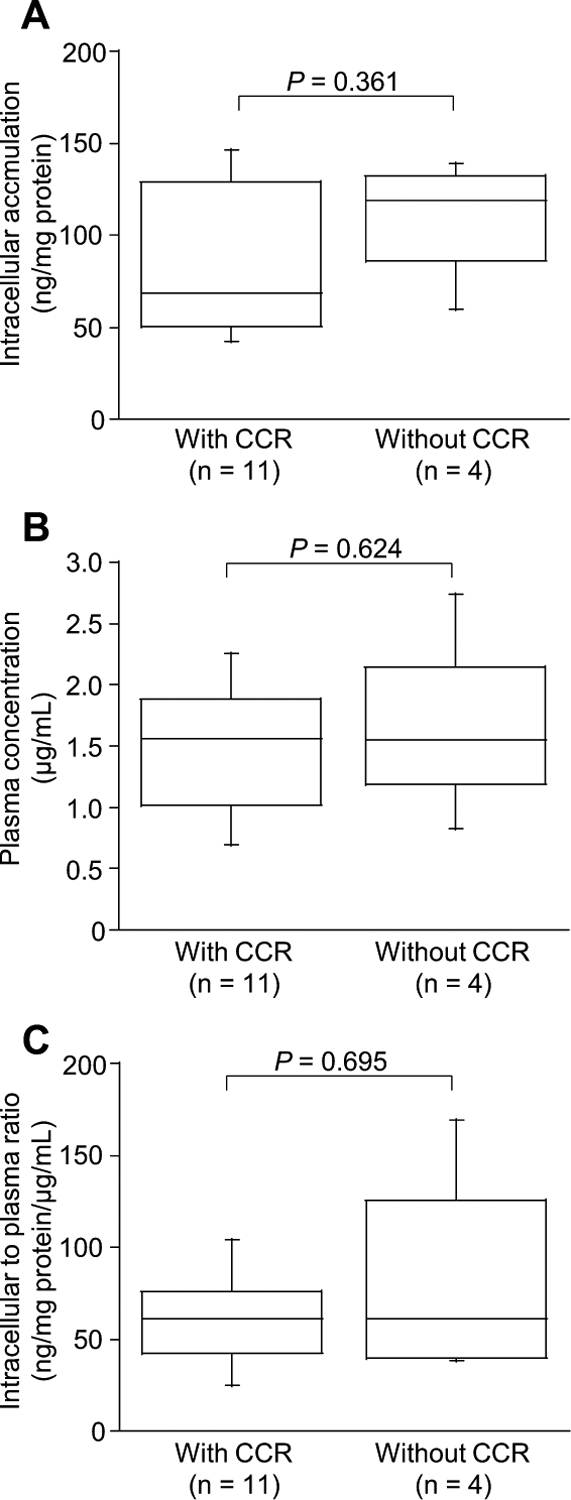
Boxes represent the distribution of the 25th and 75th percentiles; lines within boxes represent median values. Bars represent ranges. The Mann–Whitney U test (A and C) and Student’s t test (B) were used for two-group comparisons. Differences were considered statistically significant at p<0.05.