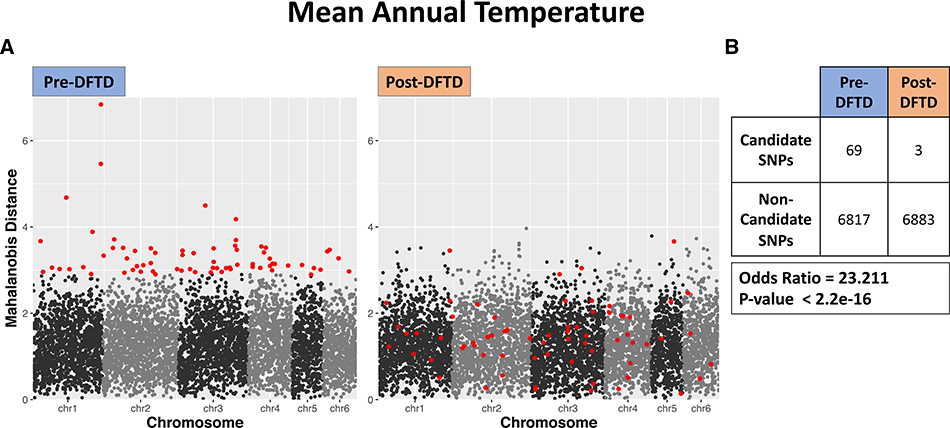
Figure 3.
Mahalanobis distances from MINOTAUR for each SNP pre-DFTD arrival (left plot) and post-DFTD arrival (right plot) for GEAs with mean annual temperature. SNPs are ordered by position along the chromosomes. The top 1% of loci with the largest Mahalanobis distance values pre-DFTD are indicated in red. (b) Post-hoc analyses found that a significantly greater number of candidate loci detected pre-DFTD arrival were not detected post-DFTD arrival. This trend was detected consistently across all eight of the abiotic environmental variables tested in genetic-environmental association analyses (output from the remaining seven variables can be found in Fig. S2).

