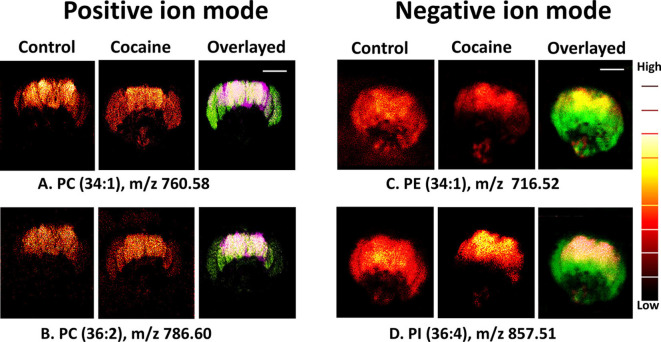
Figure 2.
Distribution of biomolecules in the Drosophila brain before and after cocaine treatment by ToF-SIMS in positive and negative ion modes. Image area: 800 × 800 μm2 and 256 × 256 pixels; pixel size, ~3 μm. Overlaid images: (A,B) purple, control brain; green, cocaine-treated brain (positive ion mode); (C,D) green, control; red, treated brain (negative ion mode). Scale bar: 200 μm. A color “thermal” scale is shown. This shows marked differences in the distribution of lipids after the introduction of cocaine, particularly in the negative ion mode. This may indicate that behavioral changes induced by cocaine can be related to changes in lipid distribution, and can be observed through SIMS. Reprinted with permission from Philipsen et al. (2018).

