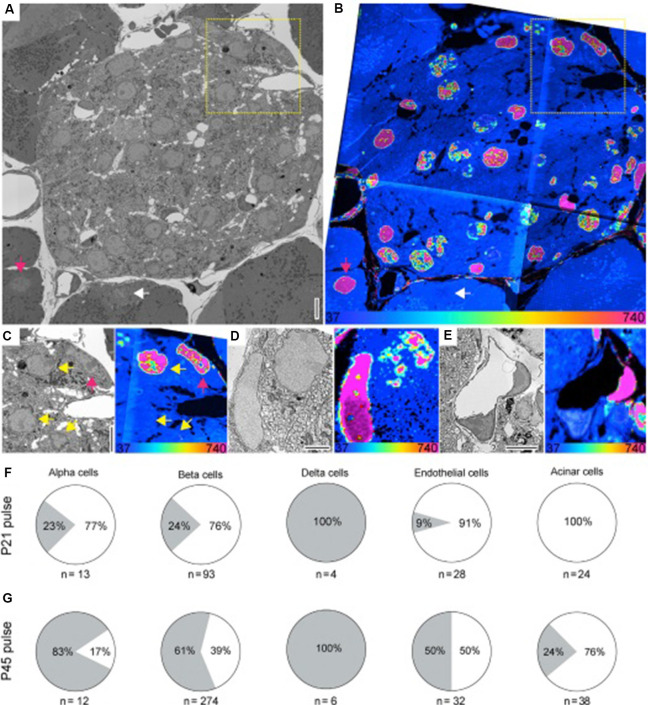
Figure 6.
(A,B) SEM (A) and MIMS (B) of a cross-section of the islets of Langerhans (pancreas). Old and young acinar cells are indicated by the pink and white arrow, respectively. Yellow dotted box highlights cells shown in (C). (C) Enlarged view of boxed region in (A) and (B). SEM and MIMS of beta cells (yellow arrows) and an old alpha cell (pink arrow). (D) An old delta cell (left) next to a younger beta cell (top right). (E) SEM and MIMS of a young (bottom) and an old (top right) endothelial cell. Old pancreatic stellate cells are seen in the top and lower right corners. (F) Relative turnover in percentages of cells that are as old (gray) or younger (white) than L2 neurons from 15N-SILAM P21 mouse chased for 26 months. (G) Same as in (F), but from a 15N-SILAM P45 mouse chased for 18 months. The total number of cells analyzed for each cell type is listed underneath each pie chart. At the bottom of the MIMS images, the heatmap shows the 15N/14N x 104 and scaled with an HSI. Scale bars: 5 μm (A,C,E) and 2.5 μm (D). In this case, the 15N label represents “older” cells. Thus, the 15N label can be used to identify long-lived cells in the pancreas, and using a pulse-chase experiment, shows the period during which cellular turnover is most likely to occur. Reprinted from Arrojo e Drigo et al. (2019) with permission from Elsevier.

