
Figure 2 -. Variation of NP cytosolic transfer for tumor lesion of VERY LOW vascular heterogeneity,
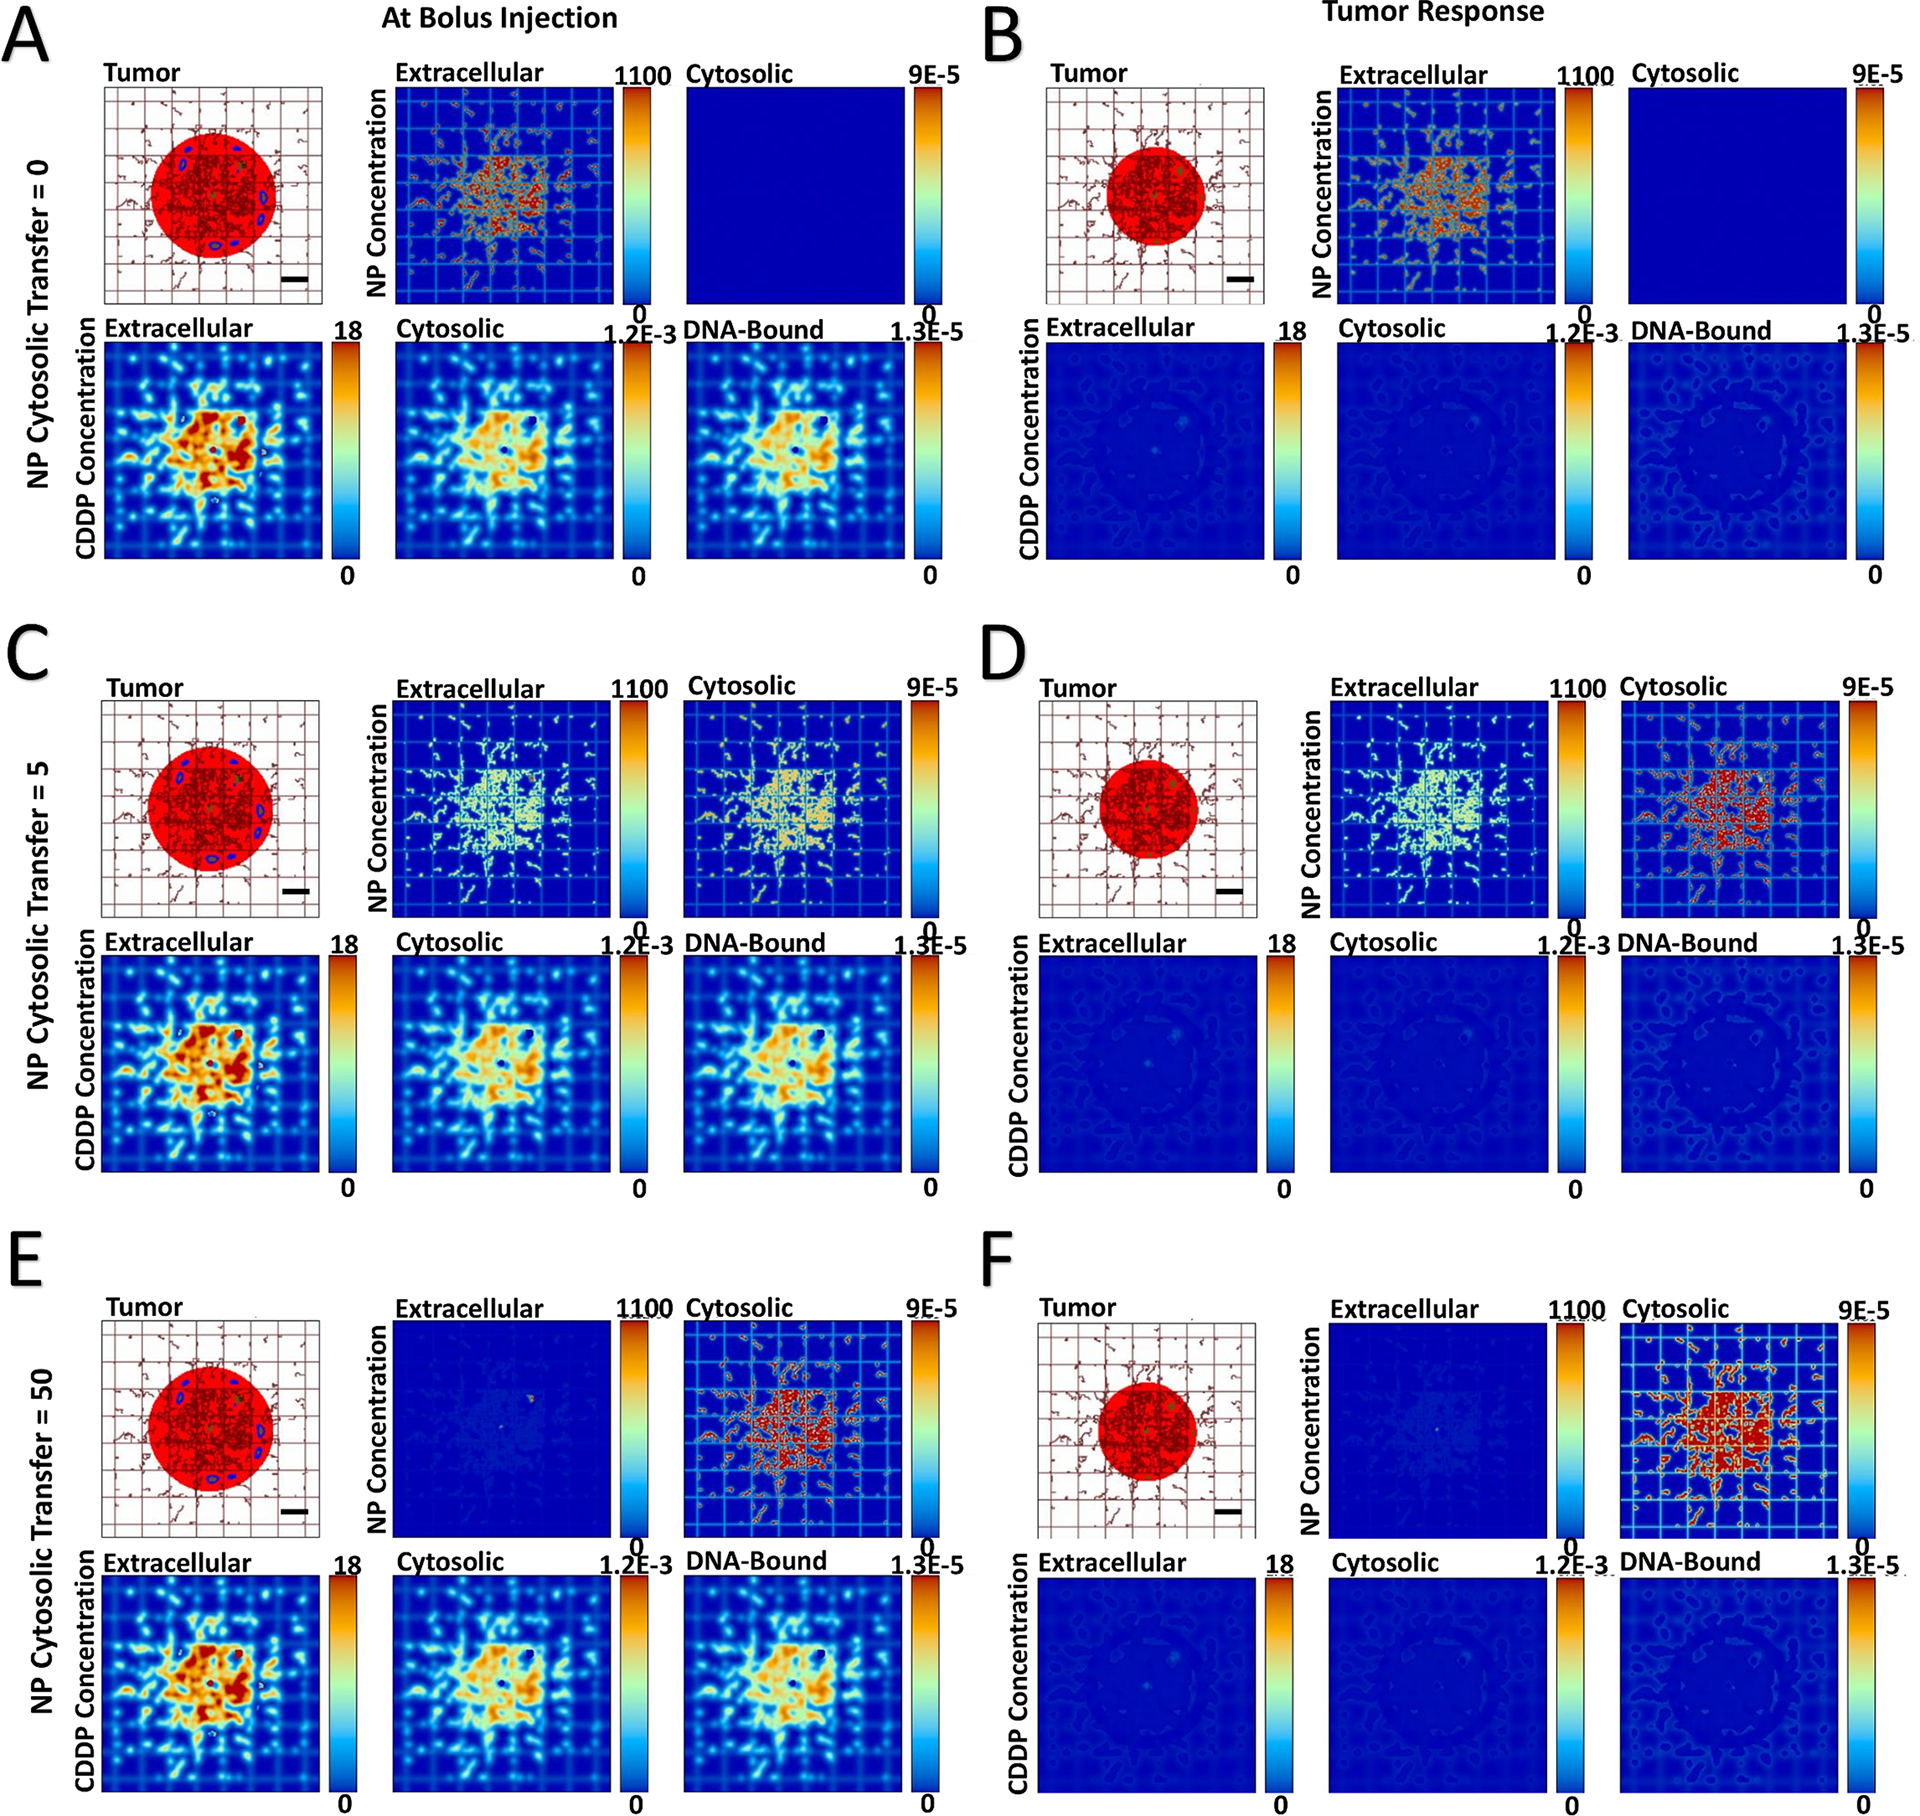
showing spatial distribution of PLGA NPs and cisplatin (CDDP) in the three compartments of the model. The NP cytosolic transfer coefficient was varied from low (=0), medium (=5), and high (=50) values. Images are from the first output interval immediately after bolus injection of CDDP-loaded NPs (Panels A, C, E) and the second output interval after the drug has taken effect (Panels B, D, F). Drug concentration is shown for extracellular (μM), cytosolic (Fmol × hr), and DNA-bound (Fmol × hr) compartments. Colors are as in Figure 1. Bar = 200 μm.