
Figure 6 -. Extracellular, cytosolic, and DNA-bound cisplatin area-under-the-curve (AUC) as a function of vasculature-induced tumor tissue heterogeneity.
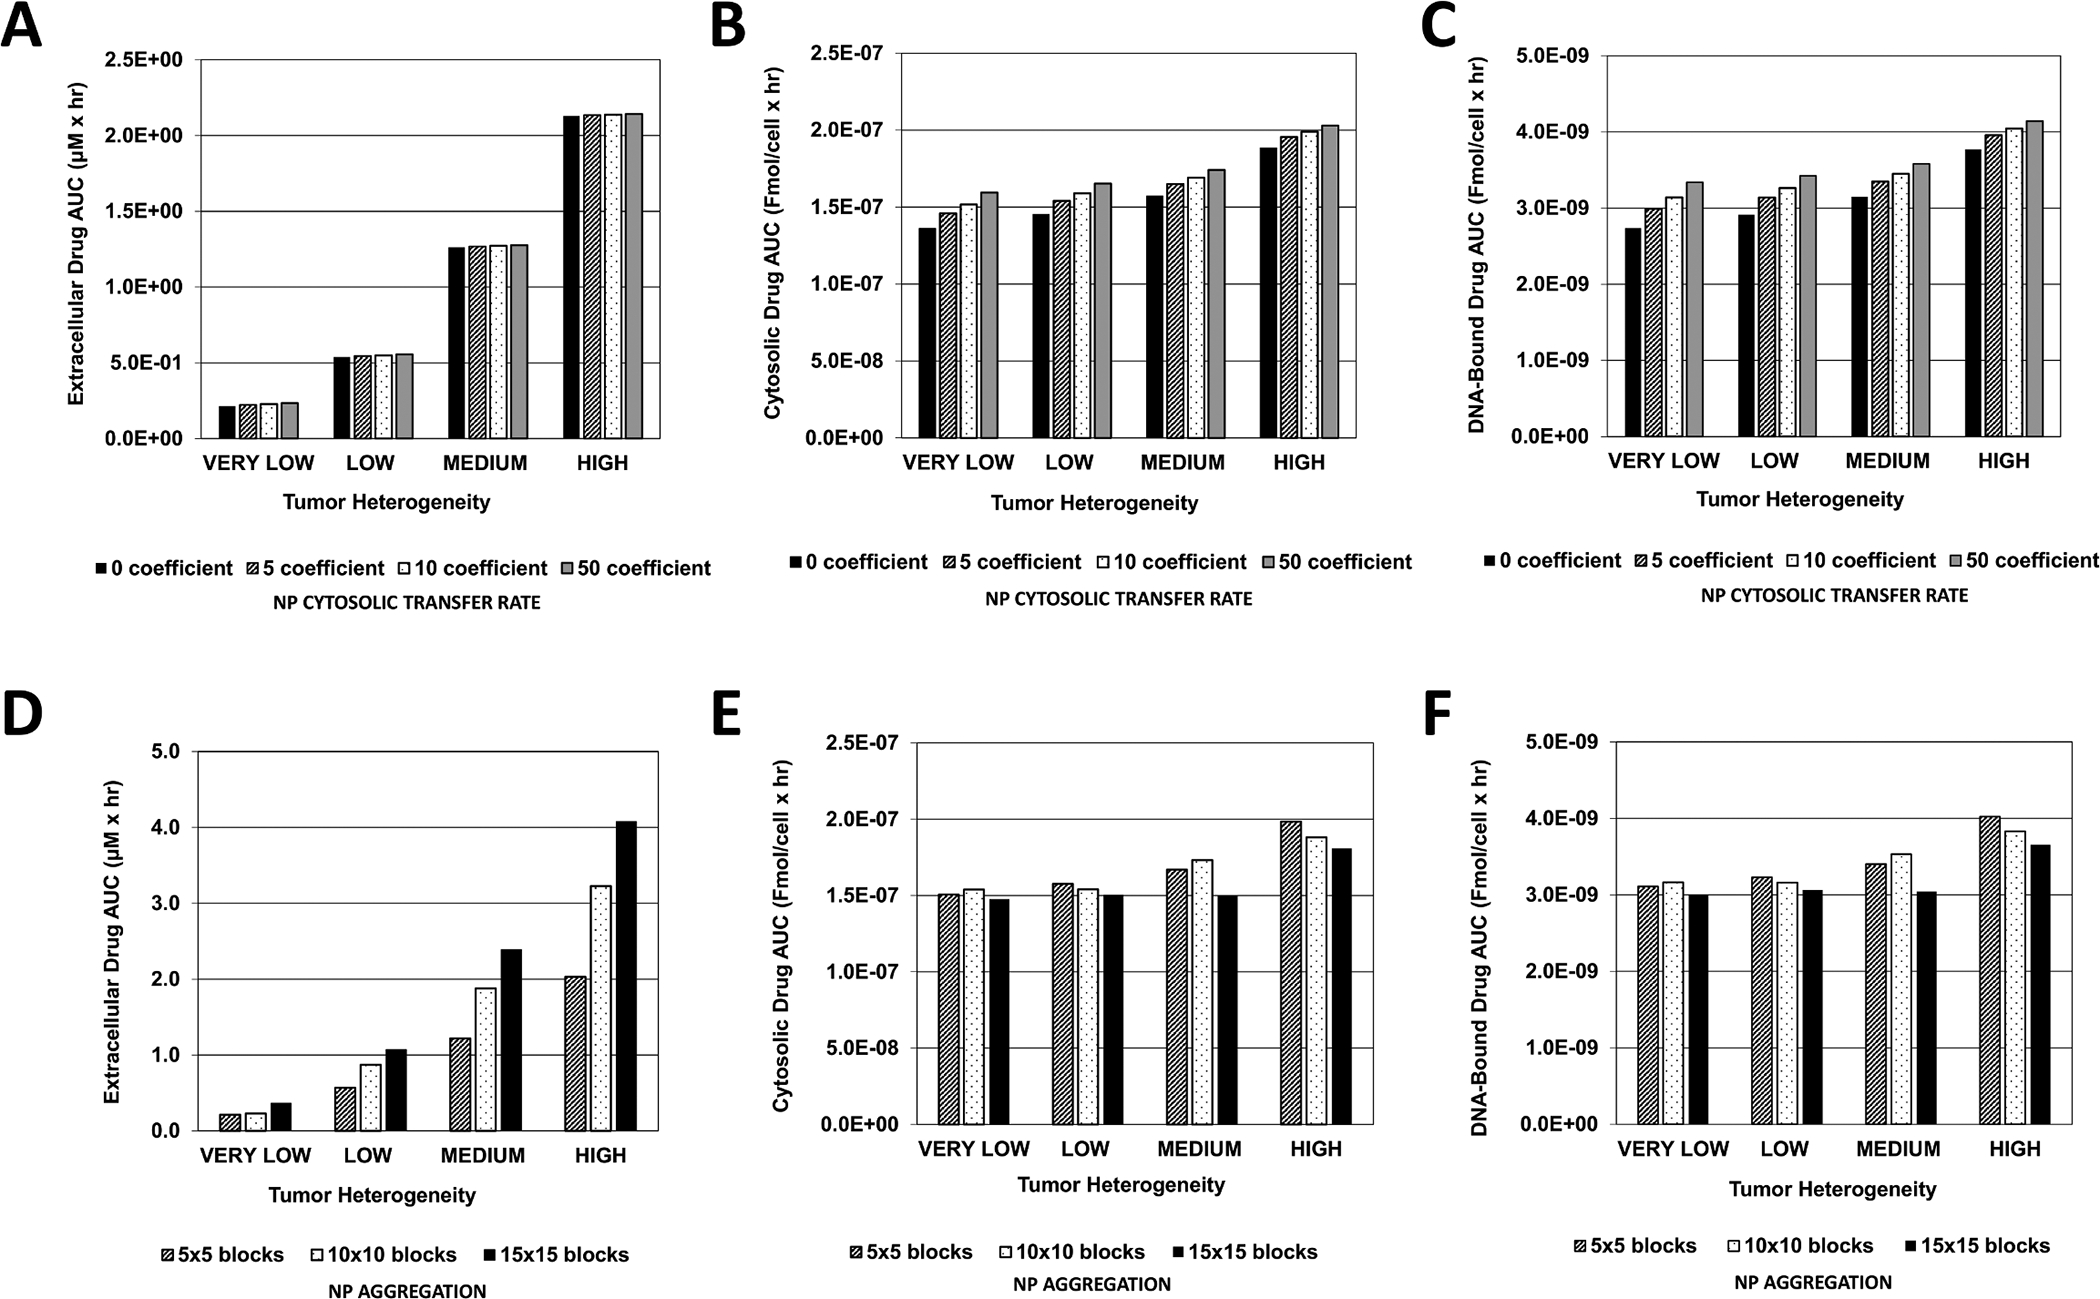
Graphs represent the magnitude of the AUC calculated within the tumor boundary at every output interval during treatment with cisplatin-loaded NPs. (A) Extracellular (μM × hr), (B) Cytosolic, and (C) DNA-Bound drug AUC due to variation in NP cytosolic transfer rate (Fmol/cell × hr); (D) Extracellular (μM × hr), (E) Cytosolic, and (F) DNA-Bound drug AUC due to variation in NP aggregation (Fmol/cell × hr).