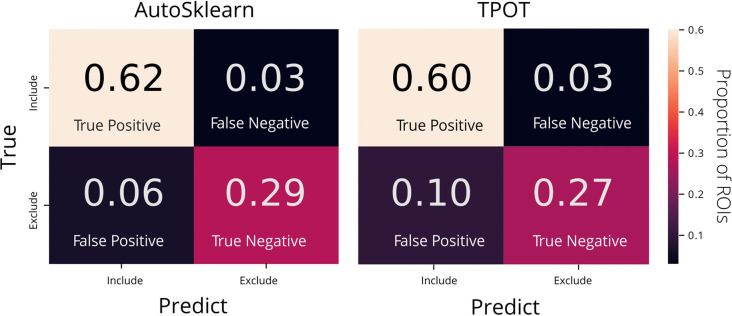
Figure 3.
Confusion matrices of AutoML tools: TPOT and AutoSklearn. Each cell in the matrix is annotated with the proportion of ROIs labeled as Include or Exclude according to the predicted and true labels. Colors indicate the relative proportions of the labels where lower proportions are darker in color and higher proportions are lighter in color. The confusion matrices were made from predictions on the test set from the best models output by AutoSklearn (left) and TPOT (right).

