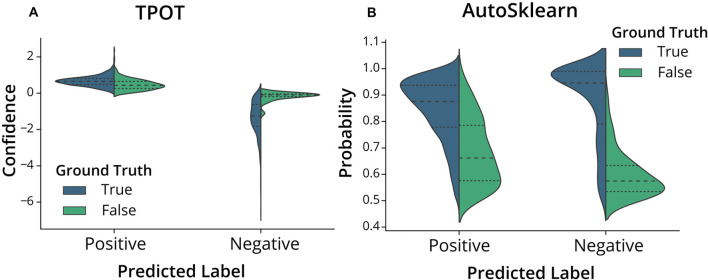
Figure 4.
Classifier confidence (TPOT) and class probabilities (AutoSklearn) on predicted false positives and false negatives. Violin plots of the distribution of (A) TPOT classifier confidence or (B) AutoSklearn class probabilities on predicted ROI labels (Positive for Include, or Negative for Exclude) in the test set. Each half of the violin plot is the distribution of values for correct labels (True, left/blue) or incorrect (False, right/green) based on the ground truth labels.

