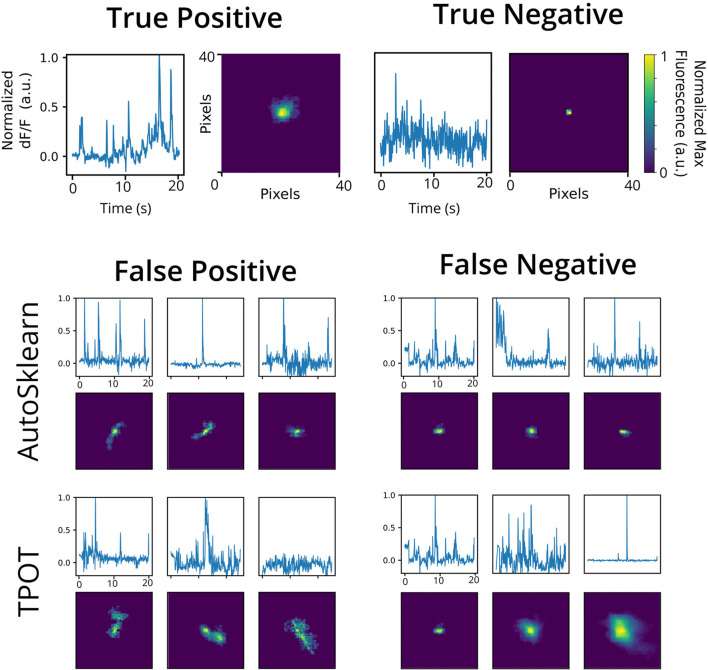
Figure 5.
Representative false positives and negatives compared to ground truth ROIs. Example calcium traces (top) and spatial footprints (bottom) from ground truth positive- (left) and negative-labeled (right) ROIs. Example calcium traces (top) and spatial footprints (bottom) of false positive and false negative ROIs predicted from the AutoSklearn (middle row) or TPOT (bottom row) classifiers.

