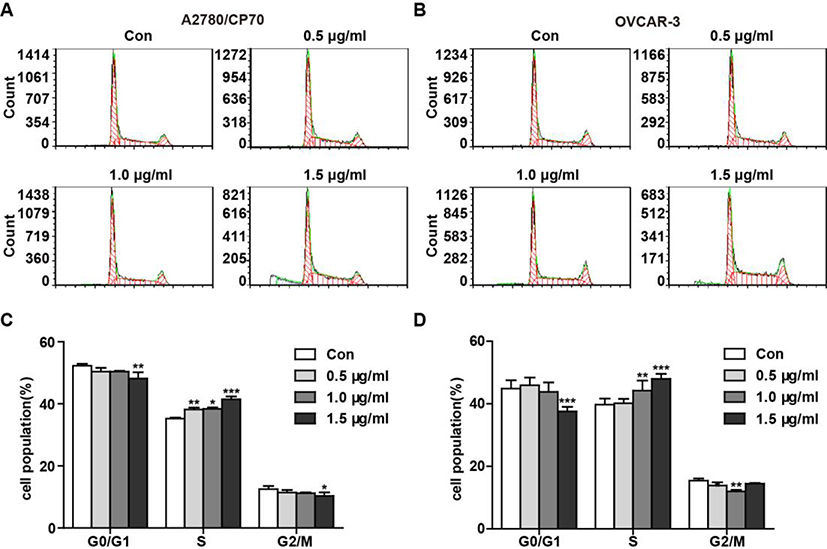
Fig. 6 -. TFS caused cell cycle arrest at S phase in A2780/CP70 and OVCAR-3 cells.
(A, B) Flow cytometry analysis of cell cycle phase distribution in A2780/CP70 (A) and OVCAR-3 (B) cells after treatment with 0, 0.5, 1.0 and 1.5 μg/ml TFS for 24 h. Cell number shown in the Y axis indicates peak value of the cell cycle phase. (C, D) Histograms displayed the percentage of cell cycle distribution in A2780/CP70 (C) and OVCAR-3 (D) cells. Data were expressed as mean ± SEM from three independent experiments. *P < 0.05, **P < 0.01, and ***P < 0.001 versus control cells which were not exposed to TFS.

