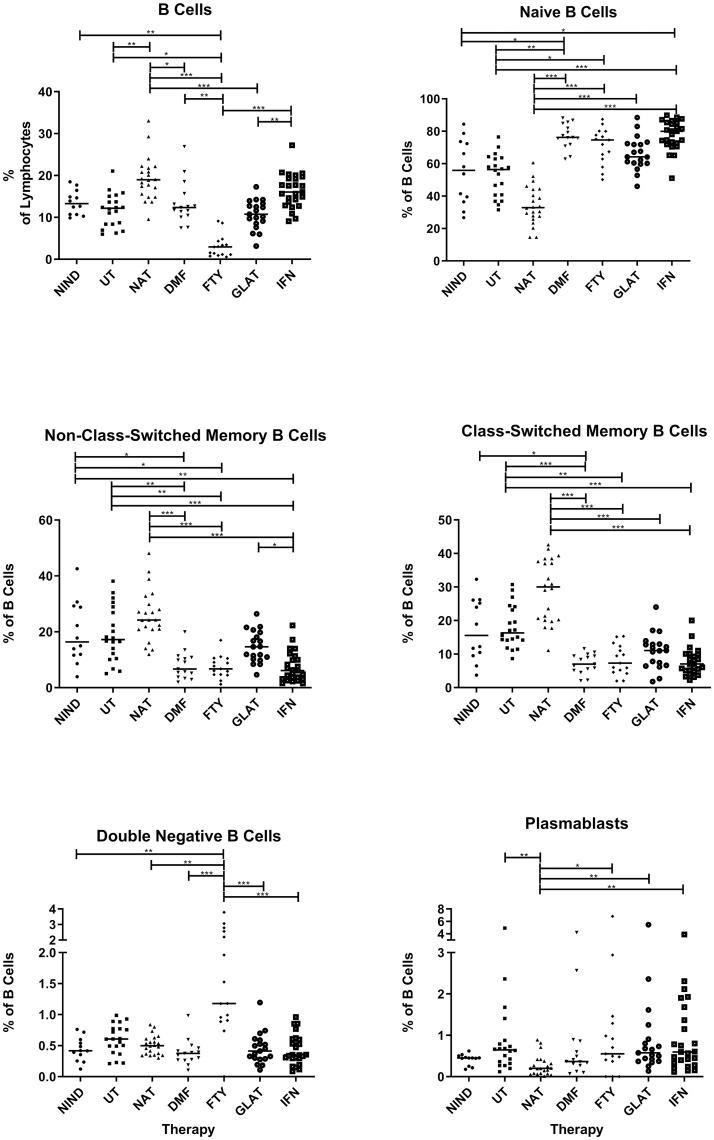
Fig 3. Percentage distribution B cell populations under different treatments.
Displayed are the percentages of B cells of all lymphocytes and the percentages of B cell subpopulations relative to all B cells for different treatments (NIND = non-inflammatory neurological disease, UT = untreated MS patients, NAT = natalizumab, DMF = dimethyl fumarate, FTY = fingolimod, GLAT = glatiramer acteate and IFN = interferon-β treated MS patients). Lines in the graphs indicate median values and asterisks describe significant differences (Kruskal-Wallis test with Bonferroni correction) as follows: (*) p ≤ 0.05, (**) p < 0.01, (***) p < 0.001.

