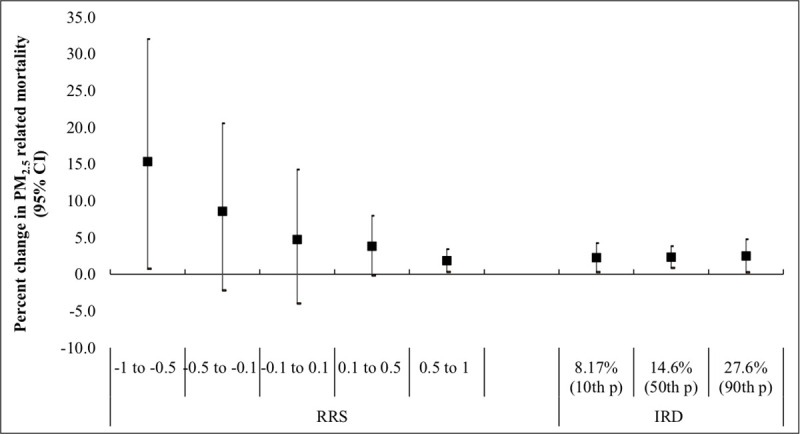
Fig 2. Percent change in CVD mortality risk per 10μg/m3 of PM2.5 among decedents in Massachusetts (2001–2011): Modification by Racial Residential Segregation (RRS) and Index of Racial Dissimilarity (IRD).

For RRS, the first two groups indicates predominantly black non-Hispanic residents in block group (-1 to -0.5 and -0.5 to -0.1), the middle group (-0.1 to 0.1) indicates equal distribution of white and black non-Hispanic populations, and the last two group (0.1 to 0.5 and 0.5 to 1) indicate predominantly white non-Hispanic residents in the block group. The first group was considered as a reference group. The IRD ranges between 0% and 100% and compares the distributions of race in the block groups and the census-tracts. Higher IRD indicates higher dissimilarity in the distribution of blacks between the block group and the census tract. The p values for the interactions between PM2.5 and RRS were p = 0.48 for RRS -0.5 to -0.1, p = 0.23 for RRS -0.1 to 0.1, p = 0.142 for RRS 0.1 to 0.5, and p = 0.072 for RRS 0.5 to 1. The p value for the interaction between PM2.5 and IRD was p = 0.811.
