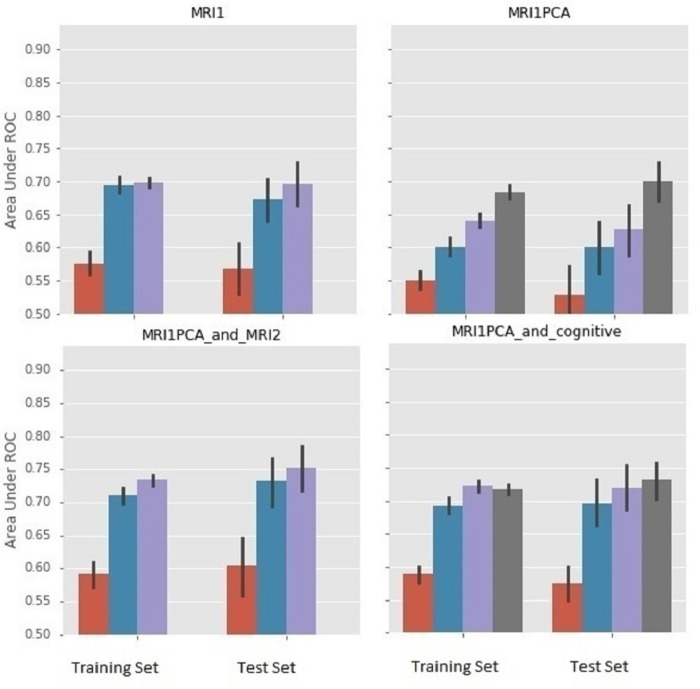
Fig 2. Comparison of different MRI representations & combining baseline MRI data with cognitive or MRI atrophy data.
Color coding for bars: red–CART, blue–gradient boost, GB; purple—random forest, RF; dark gray–support vector machine, SVM. For each plot, bars on the left represent performance using leave-two-out cross-validation on the training set, whereas bars on the right represent performance using an independent 45 person test set. The test set was never seen in training and was randomly selected in that it was the complement to the randomly selected training set. We interpreted results from the test set.

