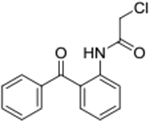
Table 1.
Average IC50 Values of analogs. (Experiment triplicates with 95% confidence intervals of IC50 showing in parentheses)
| Compound NO. | AQ ID | Structure | IC50 (μM) |
|---|---|---|---|
| 1 | AQ-101 |  |
1.37 (0.96-1.96) |
| 3a | AQ-270 |  |
2.06 (1.81-2.36) |
| 3b | AQ-271 |  |
> 50 |
| 3c | AQ-272 |  |
> 50 |
| 6 | AQ-285 |  |
2.27 (2.14-2.40) |
| 9 | AQ-273 |  |
3.12 (2.32-4.18) |
| 12a | AQ-332 |  |
>50 |
| 12b | AQ-333 |  |
>50 |
| 13 | AQ-131 |  |
0.74 (0.62-0.89) |
| 17 | AQ-283 |  |
>50 |
| 18 | AQ-284 |  |
1.75 (1.27-2.41) |
| 19 | AQ-317 |  |
17.6 (16.7-18.6) |
| 20 | AQ-340 |  |
>50 |
| 22 | AQ-282 |  |
≈50 |
| 25 | AQ-300 |  |
25.9 (25.2-26.6) |
