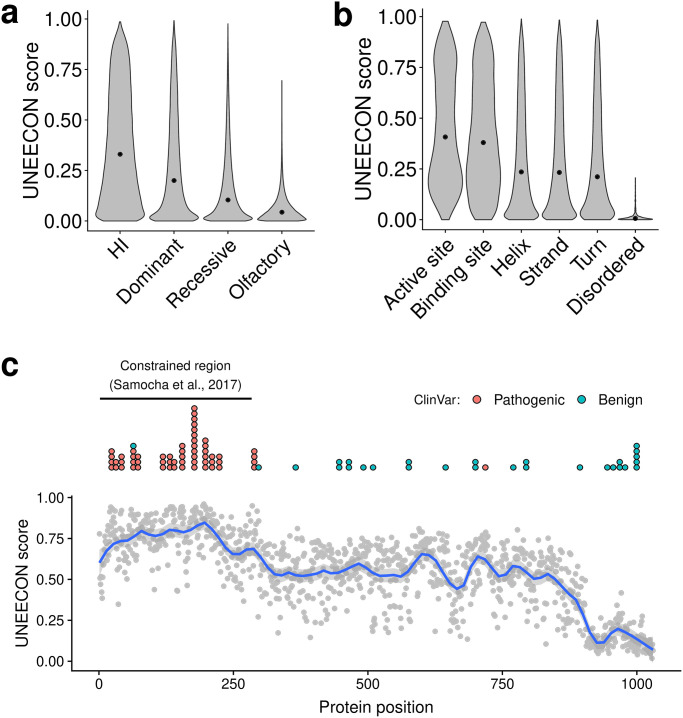
Fig 2. Distributions of UNEECON scores across potential missense mutations.
(a) Distributions of UNEECON scores estimated for potential missense mutations in haploinsufficient (HI) genes [37], autosomal dominant disease genes [35, 36], autosomal recessive disease genes [35, 36], and olfactory receptor genes [45]. (b) Distributions of UNEECON scores estimated for potential missense mutations in various protein regions. The functional sites and protein secondary structures are based on UniProt annotations [47]. The predicted disordered protein regions are from MobiDB [48]. (c) Average UNEECON scores estimated for all codon positions in the CDKL5 protein. Each grey dot represents the UNEECON score averaged over all missense mutations in a codon position. Blue curve represents the locally estimated scatterplot smoothing (LOESS) fit. Blue and red dots represent pathogenic and benign missense variants from ClinVar [30], respectively. The horizontal line represents a constrained region reported in a previous study [25].

