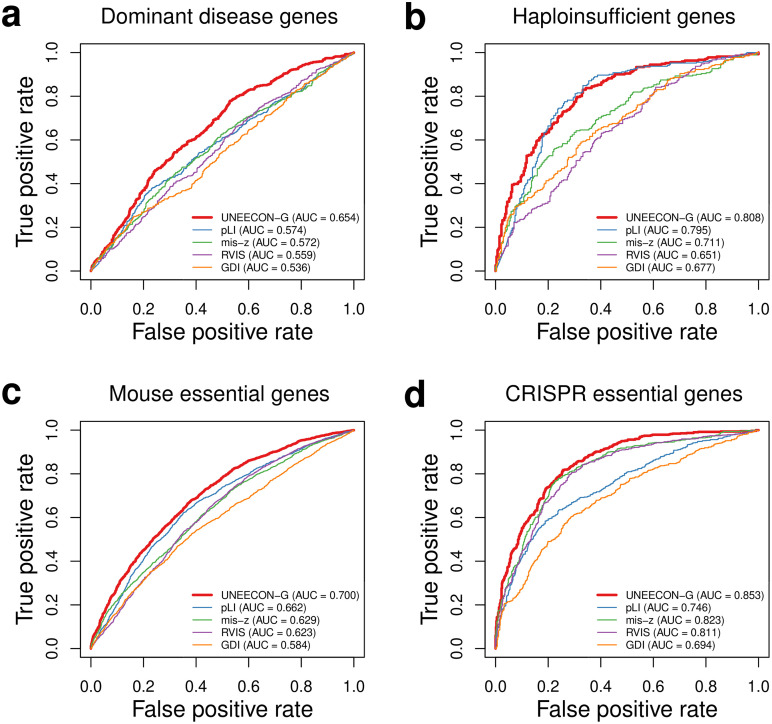
Fig 4. Predictive power of various methods for distinguishing disease and essential genes from genes not likely to have strong phenotypic effects.
(a) Performance in predicting autosomal dominant disease genes [35, 36]. (b) Performance in predicting haploinsufficient genes [37]. (c) Performance in predicting human orthologs of mouse essential genes [33, 34]. (d) Performance in predicting human essential genes in cell lines [32]. True positive and true negative rates correspond to the fractions of positive and negative genes exceeding various thresholds, respectively. AUC corresponds to the area under the receiver operating characteristic curve.

