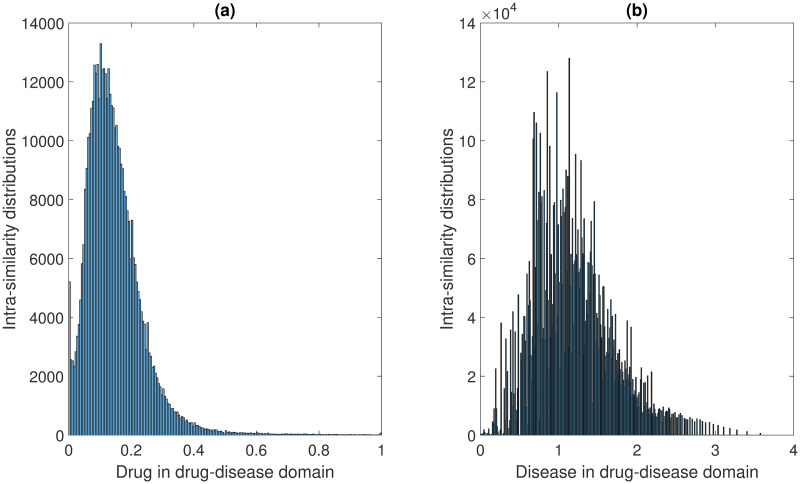
Fig 2. The intra-similarity distributions in drug-disease domain.
(a) The intra-similarity distributions of drug pairs, the drug-drug similarities are calculated based on Tanimoto Score. (b) The intra-similarity distributions of disease pairs, the disease-disease similarities are computed based on the semantic similarity of MeSH terms. Note that all the self-similarity values of drugs and diseases have already been excluded in the histograms.

