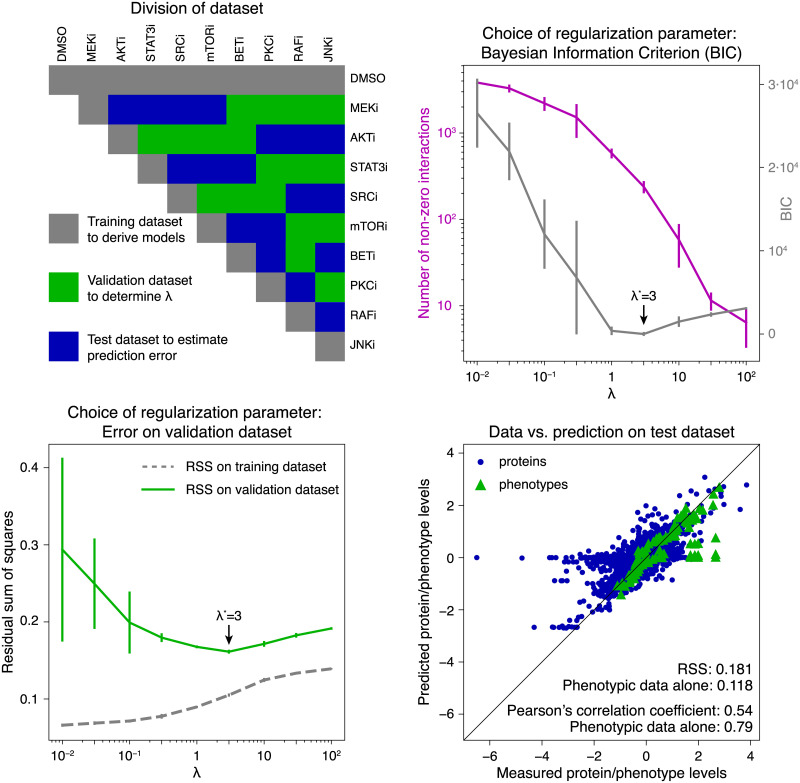
Fig 3. Model selection and error estimation.
Top left: The full dataset was divided into subsets: (i) a training dataset (gray) that contained single drug control measurements (DMSO), single drugs in low (first row) and high dose (diagonal, two times low dose), (ii) a validation dataset (green) was used to estimate the optimal regularization parameter λ*, and (iii) a test dataset (blue) was used to estimate model performance. Top right: calculated values for the Bayesian Information Criterion (BIC, gray) and number of non-zero interactions (magenta) as a function of the regularization parameter λ. Bottom left: The residual sum of squares on the validation dataset was used to identify the optimal regularization parameter λ*. The best predictive model was obtained for λ* = 3 according to lowest BIC and minimal error on the validation dataset. Error bars indicate the standard deviation from 10 independent runs. Bottom right: Agreement of measured and predicted protein and phospho-protein (dots) and phenotype levels (triangles) on the test dataset. The Pearson correlation coefficient on left-out data for the combined set of molecular and phenotype nodes is 0.54, and 0.79 for phenotypic nodes alone. The mean RSS for the combined phenotypic and molecular nodes is 0.181, and 0.118 for the phenotypic nodes alone.

