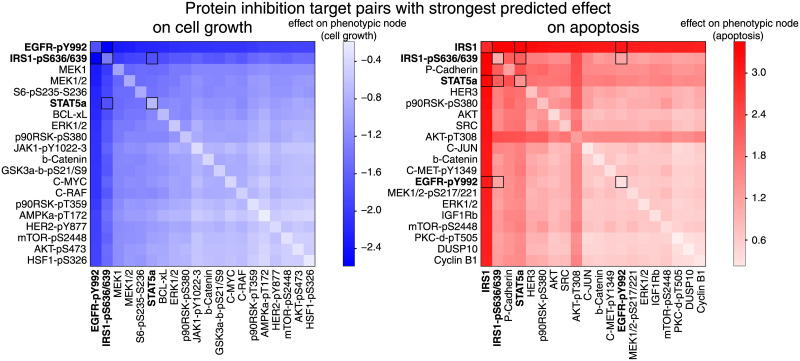
Fig 5. Model predicts the effect of combination perturbations and suggests optimal inhibitor combinations.
The top 20 × 20 predictions of pairwise inhibition of molecular nodes (i.e., proteins and phospho-proteins) that decrease cell growth (bottom left, blue) and increase apoptosis (bottom right, red). Cell growth and apoptosis were computed for each target combination. These values were log2-transformed, normalized to the unperturbed steady state, and the average value over 101 network model predictions is presented (diagonal represents predictions for inhibition of single targets). Combinations nominated for drug testing are highlighted by dark-rimmed squares. For complete heatmaps of all tested predictions, see S8 and S9 Figs.

