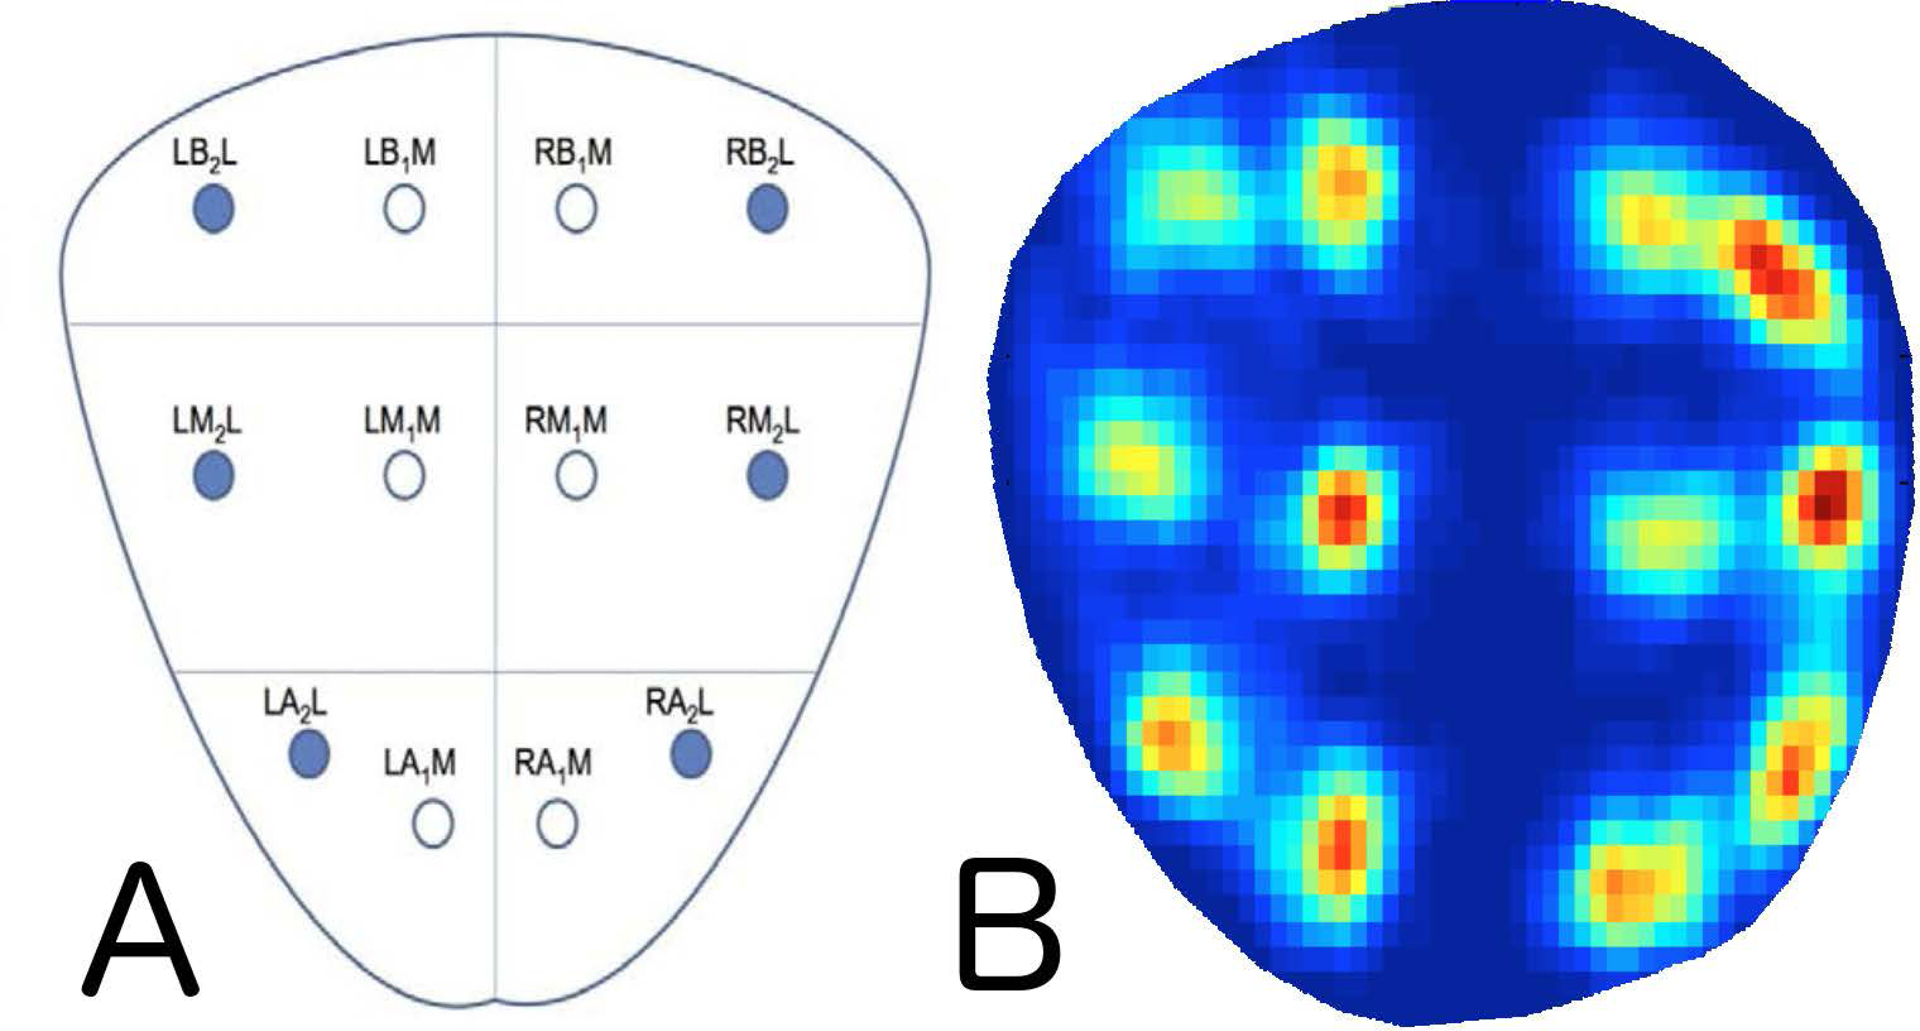
Figure 2.

Diagram of standard systematic biopsy locations (A) and the corresponding visualization/distribution of template mapping biopsy cores from this cohort (B), scaled to a standard 25cc prostate. Dark blue represents locations that are never sampled throughout the prostate, whereas a standard heat scale from blue to red demonstrate increased frequency of sampling around template locations.
