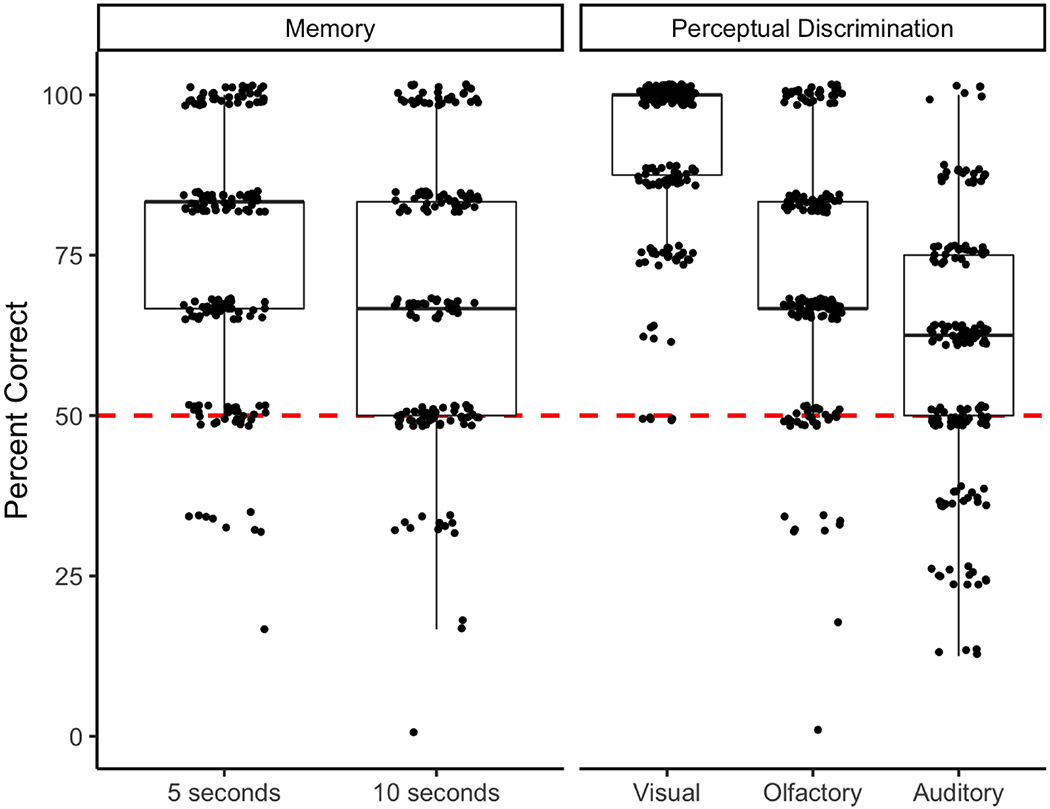
Figure 3.

Performance on the memory task (at 5 s and 10 s delays) and perceptual discrimination (visual, olfactory, auditory) tasks. The data are presented in a box plot, overlaid with the original data points. The lower and upper hinges correspond to the 25th and 75th percentiles, and the band inside the box is the median value. Chance performance (50%) is denoted by the red dashed line. Points are jittered to reduce overplotting.
