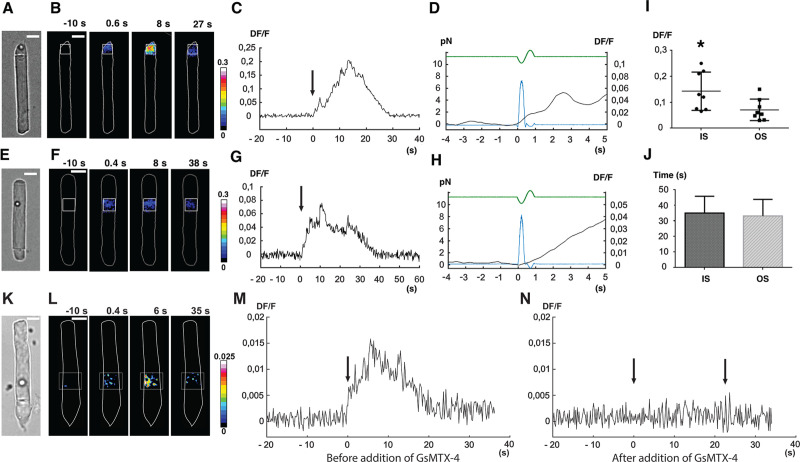
Fig 2. Calcium response of X. laevis rods (OS + IS) to weak mechanical stimulation applied in the vertical direction (i.e., orthogonal to the plane of the images in A, E, K).
(A) A trapped bead in contact with the tip of the rod IS, under bright-field IR imaging. (B) Fluorescence change (DF/F) images, showing the ROI used to quantify the fluorescence change versus time. (C) Time course of the evoked DF/F change from the ROI in B. Mechanical stimulation was applied at time 0, as indicated by the arrow. (D) Trace from panel C on an expanded time base, additionally showing the FTL driving command (green trace) used to move the trapped bead, and the resulting force pulse (blue trace); the force applied to the IS was about 8 pN. (E, F, G, and H) As in A, B, C, and D but for mechanical stimulation of the rod OS. (I) Collected results for peak DF/F (mean ± SD) induced by mechanical stimulation for IS and OS, respectively (S1 Data). (J) Mean duration of calcium transients for IS and OS, respectively (S2 Data). Significance was determined with a two-tailed Student t test with p < 0.05. A calcium transient was detected when DF/F was above 0.004, approximately equivalent to 5-fold the background noise. Termination of detected transients was taken to occur when DF/F decreased below 0.004. (J, K, L, M, and N) As in E, F, and G but for mechanical stimulation before (M) and after (N) an exposure to GsMTx-4. In panels B, F, and L of Fig 2, the color maps indicate DF/F after spatial averaging over a window of 3 × 3 pixels. In subsequent panels (C, D, G, H, and M, N), DF/F was computed over the region indicated by the white boxes in panels B, F, and L. FTL, Focus Tunable Lens; GsMTx-4, M-theraphotoxin-Gr1a; IR, infrared; IS, inner segment; OS, outer segment; ROI, region of interest.

