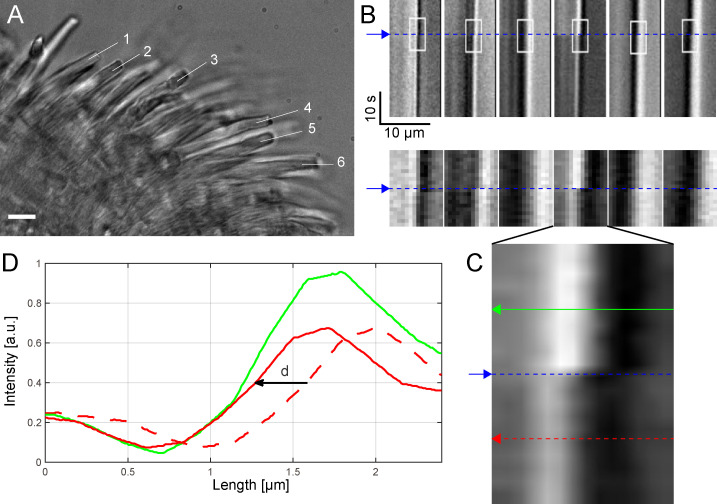
Fig 4. Light-induced shrinkage of intact rods in pieces of retina.
(A) One frame from the movie (SI) showing a piece of retina with rods (scale bar, 10 μm). (B) Kymographs calculated along linear segments at the tip of the rods labeled with numbers from 1 to 6 in A show a shift, d: {d1 = 0.24, d2 = 0.32, d3 = 0.12, d4 = 0.31, d5 = 0.28, d6 = 0.33} μm in the intensity profile after the flash (blue line), confirming rod shrinkage. Small ROIs (white rectangles with size = 14 × 20 pixels) are selected and zoomed in the second row. (C) Bilinear interpolation of 1 ROI over a grid 20× bigger (280 × 400 pixels) than the original and 2 lines selected before and after the flash and used to calculate the shift d with subpixel precision. (D) Intensity profiles (green and dotted red) before and after flash. The shift d is calculated to minimize the difference between the intensity profiles (solid red and green lines) (S3 Data). a.u., arbitrary unit; ROI, region of interest.

