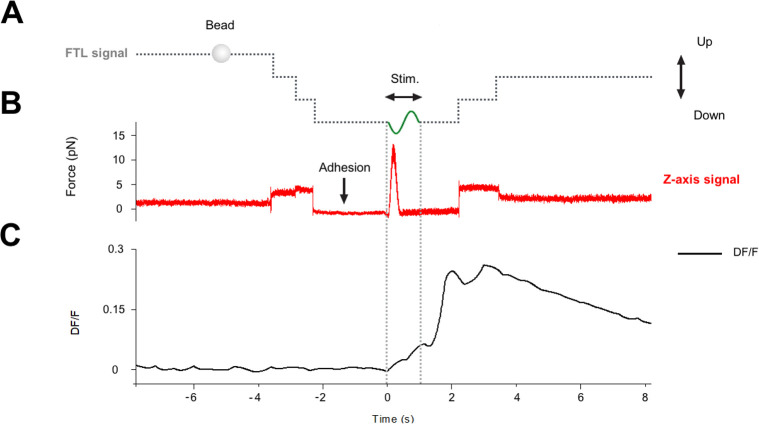
Fig 8. Analysis of the recording of the QPD trace and of DF/F.
(A) Voltage command to the FTL, controlling the vertical displacement of the optical trap. The steps in the dotted lines show the lowering of the bead before adhesion and raising of the bead after mechanical stimulation. (B) Force recorded in the vertical direction by the QPD. (C) Fluorescence signal DF/F monitoring the level of intracellular calcium. There was no change in DF/F at the time of the adhesion of the bead (marked by a decrease of noise in the force trace), but DF/F increased following the mechanical stimulation, indicated by “Stim.” FTL, Focused Tunable Lens; QPD, quadrant photodetector.

