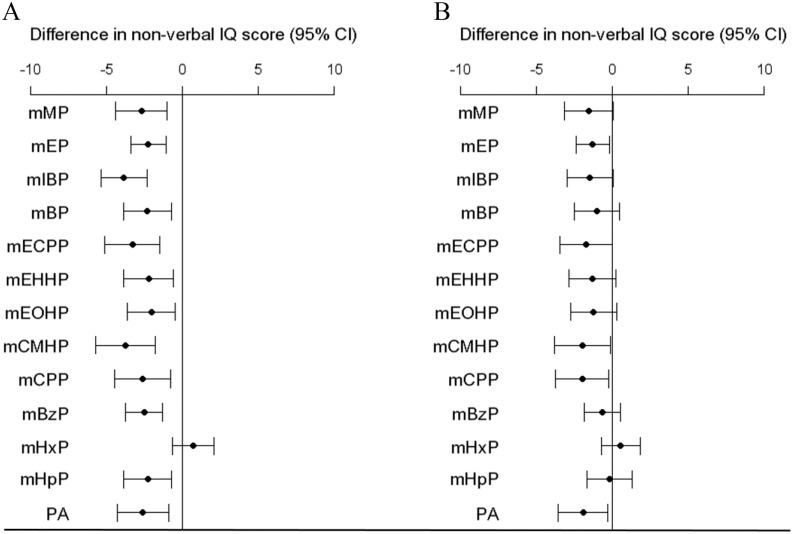
Figure 1.
Difference in nonverbal IQ per increase in phthalate metabolite concentrations in micrograms per gram creatinine at of gestation. Corresponding numeric data are reported in Table S7. A) Unadjusted model. B) Adjusted for maternal age, maternal nonverbal IQ, sex of child, age of the child at assessment, ethnicity, education, income, marital status, maternal alcohol consumption, BMI, parity categories, and smoking categories. Note: BMI, body mass index; mBP, mono-n-butyl phthalate; mBzP, monobenzyl phthalate; mCMHP, mono-[(2-carboxymethyl)hexyl]phthalate; mCPP, mono(3-carboxypropyl) phthalate; mECPP, mono-(2-ethyl-5-carboxypentyl) phthalate; mEHHP, mono-(2-ethyl-5-hydroxyhexyl) phthalate; mEOHP, mono-(2-ethyl-5-oxyhexyl) phthalate; mEP, mono-ethyl phthalate; mHpP, mono-2-heptyl phthalate; mHxP, mono-hexyl phthalate; mIBP, mono-isobutyl phthalate; mMP, mono-methyl phthalate; PA, phthalic acid.

