. 2020 Jul 13;9:e56110. doi: 10.7554/eLife.56110

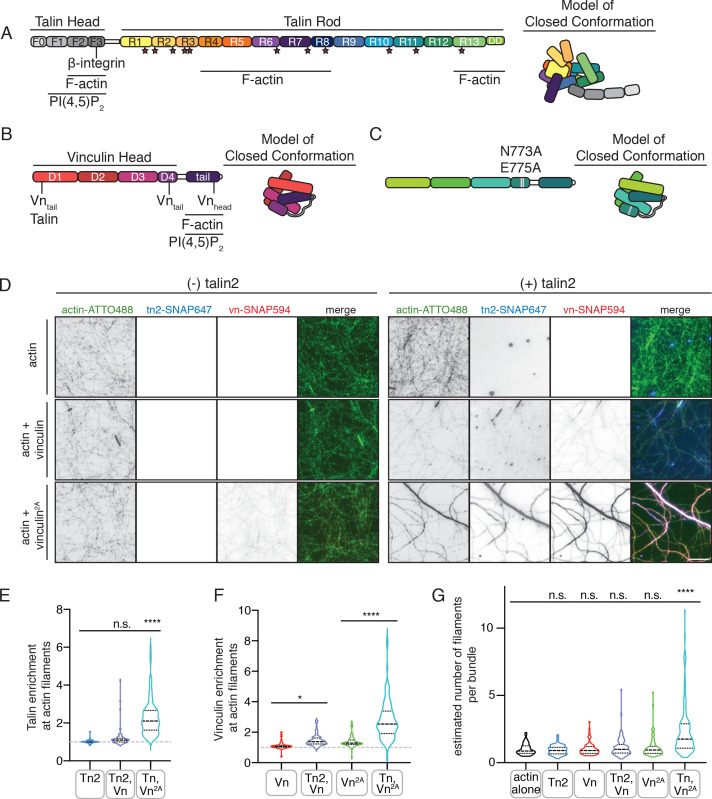
Figure 1. Autoinhibition blocks interactions between talin, vinculin, and actin in vitro.

(A) Human talin2 domain organization, left. Stars highlight predicted vinculin binding sites. To the right, a model of the closed, autoinhibited conformation of talin, based on the Tn1 autoinhibited structure (Dedden et al., 2019). (B) Human vinculin domain organization, with model of autoinhibited structure (red) and (C) human vinculin with a deregulating mutation in the D4 domain (N773A,E775A), with a model of the partially deregulated structure (green) (Bakolitsa et al., 2004; Cohen et al., 2005). (D) Representative three-color TIRF microscopy images of 1.5 µM SNAP-tag-labeled FA proteins and 1 µM actin (10% actin-ATTO488,green) added to TIRFm buffer (10 mM imidazole, 50 mM KCl, 1 mM MgCl2, 1 mM EGTA, 0.2 mM ATP, pH 7.5) supplemented with 15 mM glucose, 20 µg/mL catalase, 100 µg/mL glucose oxidase, 1 mM DTT and 0.25% methyl-cellulose (4000 cp). Images acquired after 30 min of polymerization. Scale bar = 5 µm. (E) Quantification of talin enrichment at actin filaments, compared to background Tn-SNAP647 signal, for Tn alone, with Vn wild-type, and with Vn2A. A value of 1 indicates no enrichment at filaments. (F) Quantification of vinculin enrichment at actin filaments, compared to background Vn-SNAP647 or Vn2A-SNAP647 signal, both with or without Tn2. A value of 1 indicates no enrichment at filaments. (G) Estimation of number of filaments per actin bundle for each condition shown in (D), n (from left to right)=43, 57, 60, 93, 97, 108. The average fluorescence of individual filaments in actin alone samples was used to define the signal of a single actin filament, and then used to estimate the number of filaments for each condition. n.s. >0.5,*p<0.05 ****p<0.0001, by one-way ANOVA.

Figure 1—source data 1. source data corresponding to Figure 1D–G.

Figure 1.

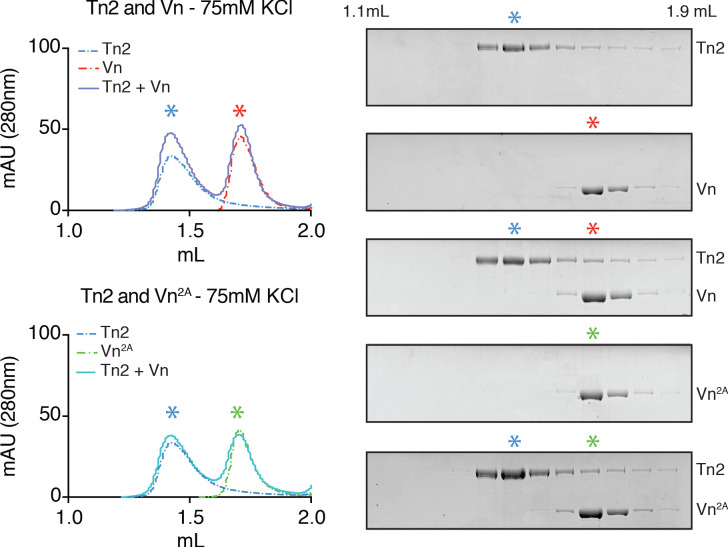
Figure 1—figure supplement 1. Talin and vinculin do not form a complex under low ionic strength conditions.

Figure 1—figure supplement 1.

Tn2, Vn, and Vn2A (5 µM) reconstitution assay using size-exclusion chromatography (SEC). Chromatograms and SDS-PAGE indicate the elution profiles of the proteins alone and in combination for Tn2,Vn (top) and Tn2,Vn2A (bottom) in 20 mM HEPES pH 7.8, 75 mM KCl, 1 mM EDTA, 3 mM β-mercaptoethanol.
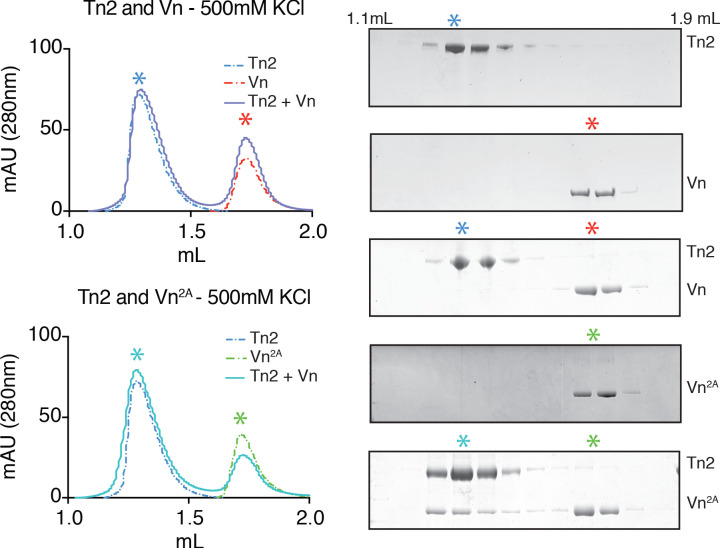
Figure 1—figure supplement 2. Partial relief of vinculin inhibition allows talin-vinculin complex formation under high ionic strength conditions.

Figure 1—figure supplement 2.

Tn2, Vn, and Vn2A (5 µM) reconstitution assay using size-exclusion chromatography (SEC). Chromatograms and SDS-PAGE indicate the elution profiles of the proteins alone and in combination in 20 mM HEPES pH 7.8, 500 mM KCl, 1 mM EDTA, 3 mM β-mercaptoethanol., for Tn2,Vn or Tn2,Vn2A.
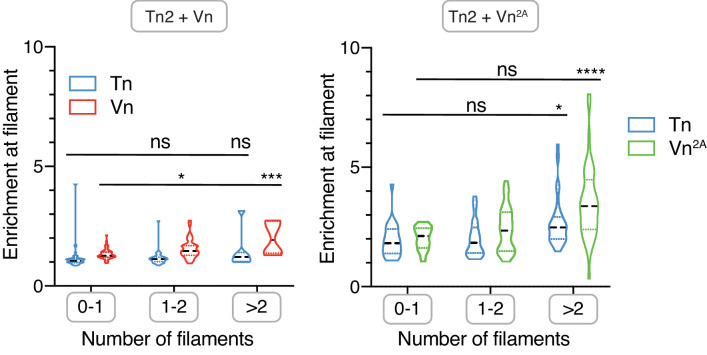
Figure 1—figure supplement 3. Talin and vinculin are enriched along multi-filament actin bundles.

Figure 1—figure supplement 3.

Enrichment of Tn2 and Vn (right) or Tn2 and Vn2A (left) along actin filaments, divided by estimated number of filaments per bundle. Tn2 and Vn2A have enrichment >1 for all filament numbers, but enrichment is higher for bundles of multiple filaments (>2). Number of filaments was estimated using the average fluorescence of single filaments from actin control samples. n.s. >0.5, *p<0.05, ***p<0.005 ****p<0.0001, by one-way ANOVA. See also Figure 1—source data 1.
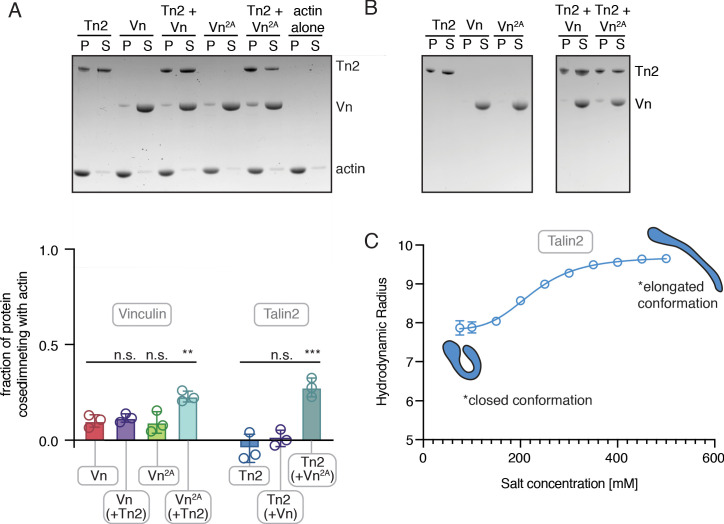
Figure 1—figure supplement 4. Talin and vinculin interact weakly with actin independently.

Figure 1—figure supplement 4.

(A) Actin co-sedimentation assay with purified Tn2, Vn, and Vn2A (5 µM) with F-actin (10 µM) in 20 mM HEPES, pH 7.5, 75 mM KCl, 2 mM MgCl2, and 0.2 mM ATP. Gel shows representative pellet and supernatant fractions. Graph shows individual data points (normalized to actin-free controls), mean densitometry, and ± SD for three independent experiments, n.s. >0.5, **p<0.01, ***p<0.005 by one-way ANOVA. (B) Control samples without actin for actin co-sedimentation shown to the right. For quantification, negative control samples were used to correct for actin-independent pelleting. We note that talin2 sedimented in the absence of actin. This was independent of incubation time, temperature over the course of the experiment, and occurs under all buffer conditions used within this study, with the exception of >400 mM KCl. However, DLS measurements (C) of hydrodynamic radius over a range of salt concentrations indicate that Tn2 undergoes a salt-dependent conformation change similar to Tn1 (Dedden et al., 2019). Based on these results, as well as the SEC results of Figure 1—figure supplements 1 and 2, Tn2 behaves similar to Tn1 and, thus, is well-folded and functional. Graph represents mean hydrodynamic radius ± SD for three independent measurements for each salt concentration in the following buffer: 20 mM HEPES pH 7.5, 500 mM KCl, 1 mM EDTA, 3 mM β-mercaptoethanol.