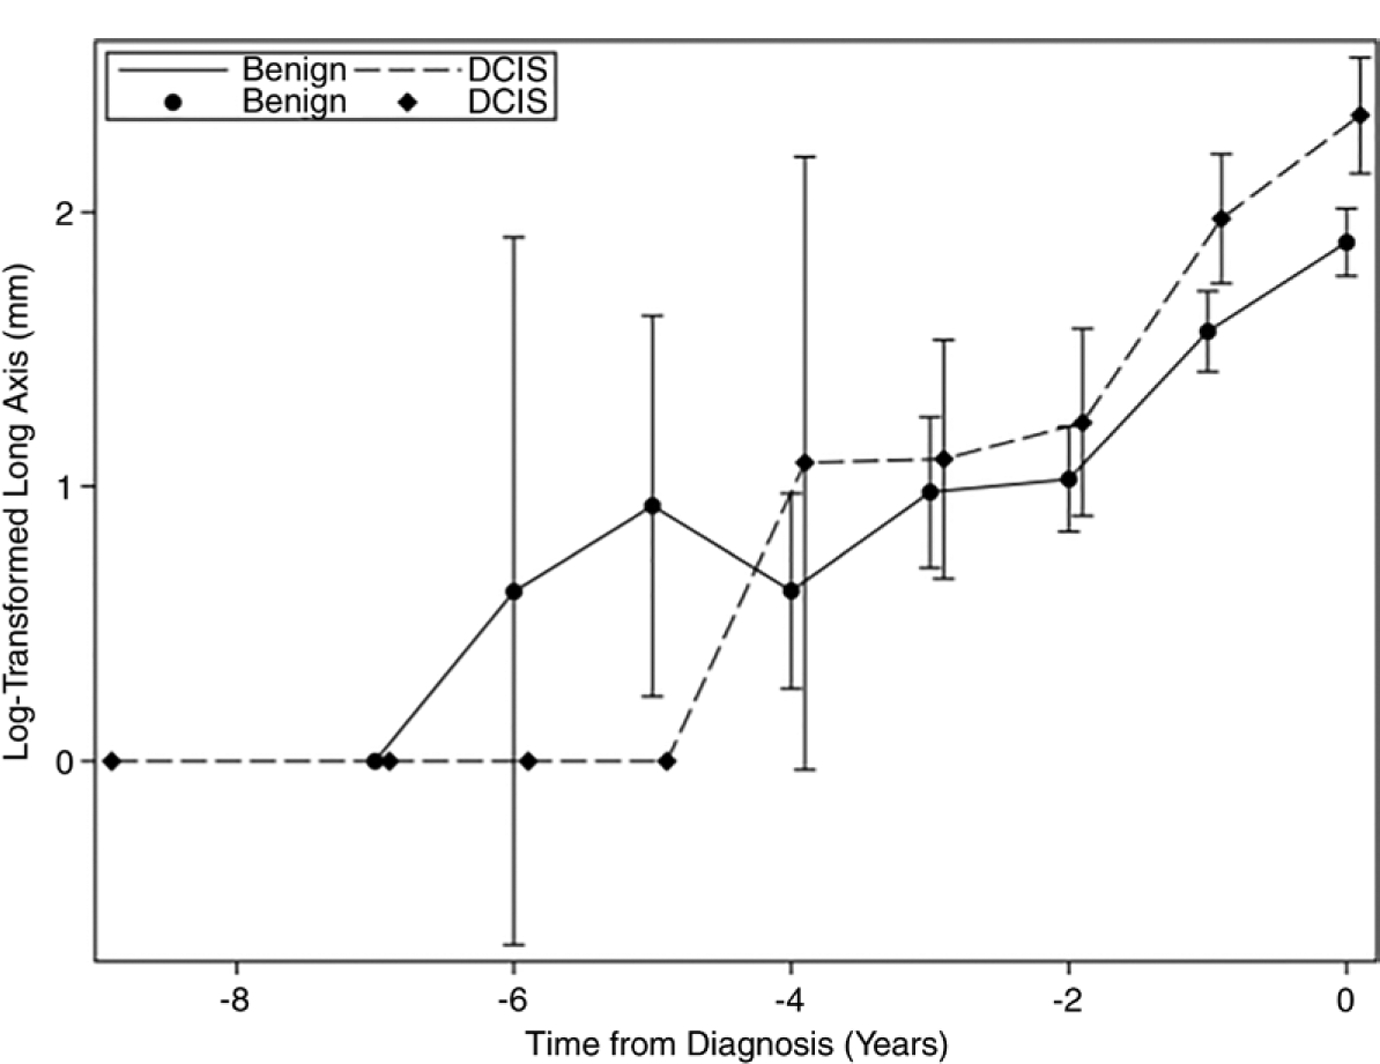
Figure 3:

The mean log-transformed long-axis length over time for ductal carcinoma in situ (DCIS) and benign breast disease, with 95% confidence intervals. The DCIS and benign data points are offset to facilitate visualization. Of note, the 0 values could not be transformed and so were set to zero after the log transformation was applied to the other mean values.
