. 2020 Jul 20;9:e55582. doi: 10.7554/eLife.55582

Figure 4. CB2 receptor-GFP immune cells infiltrate the dorsal root ganglia of the injured nerve and GFP from bone-marrow-derived cells is also found inside peripheral neurons.

The figure shows images of L3-L5 dorsal root ganglia from sham (SHAM) or nerve-injured mice (PSNL) transplanted with bone marrow cells from CB2 GFP BAC mice (CB2-GFP) or C57BL6/J mice (C57BL6/J). (A, D) Dorsal root ganglia sections stained with the nuclear marker DAPI (Blue), anti-GFP (Green), and neuronal markers anti-β-III tubulin and anti-peripherin (Red). (A) CB2-GFP mice showed significant infiltration of GFP+ bone-marrow-derived cells after the nerve injury, whereas sham or nerve-injured C57BL6/J mice did not show significant GFP immunorreactivity. Split channels in Figure 4—figure supplement 2. (B) Co-localization of CB2-GFP and the macrophage marker anti-F4/80. Co-staining with anti-GFP and anti-F4/80 revealed GFP+ (~60%) and GFP negative macrophages infiltrating the injured nerve. Split channels in Figure 4—figure supplement 3A. (C) Co-staining with anti-GFP and anti-CD45 revealed GFP+ (~40%) and GFP-negative lymphocytes infiltrating the injured nerve. Split channels in Figure 4—figure supplement 3B. (D) CB2-GFP mice showed a percentage of GFP+ neurons that was enhanced with the nerve injury. Scale bar, 140 μm. Split channels in Figure 4—figure supplement 4. Scale bar for B), C), D), 45 μm. Yellow arrows point to GFP negative cells and white arrows to GFP+ cells. A certain degree of image processing has been applied equally across the entire merged images for optimal visualization. N = 2–3 mice per group. Means and error bars representing SEM are shown. Stars represent comparisons vs. sham; diamonds vs. C57BL6/J. *p<0.05, **p<0.01, ***p<0.001. Flow cytometry of blood from CB2-GFP and C57BL6/J mice in Figure 4—figure supplement 1. Additional images of Sham and nerve-injured CB2-GFP mice in Figure 4—figure supplements 5 and 6. Specificity tests for Tyramide Signal Amplification in Figure 4—figure supplement 7. Controls for antibody specificity in Figure 4—figure supplement 8.

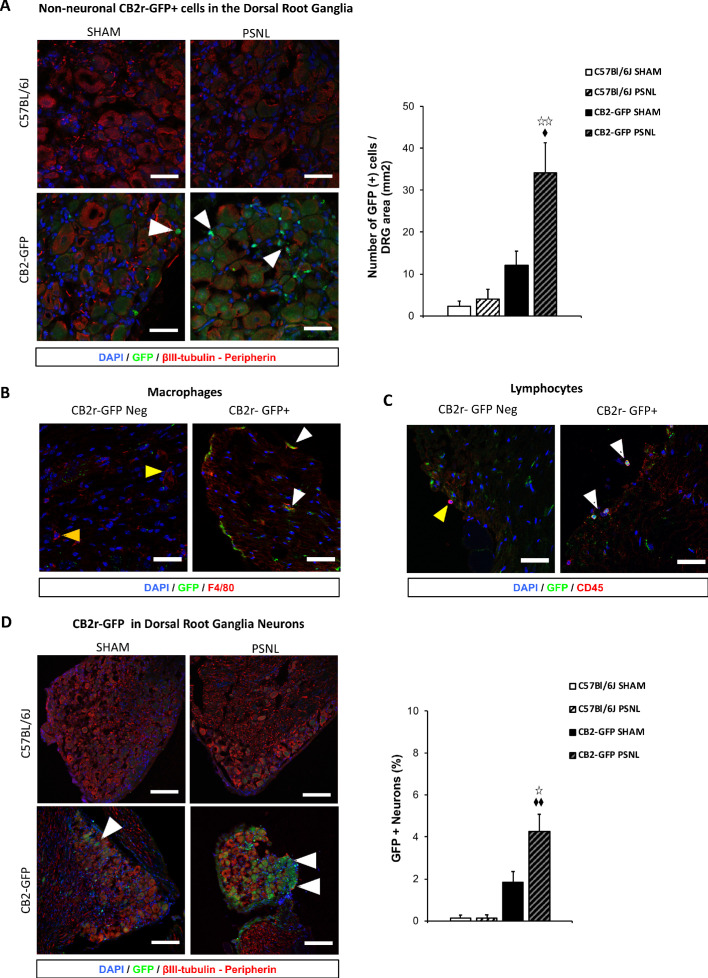
Figure 4—source data 1. CB2 GFP cells in dorsal root ganglia of C57BL6/J nerve-injured mice after bone-marrow transplants from CB2 GFP BAC mice.

Figure 4.

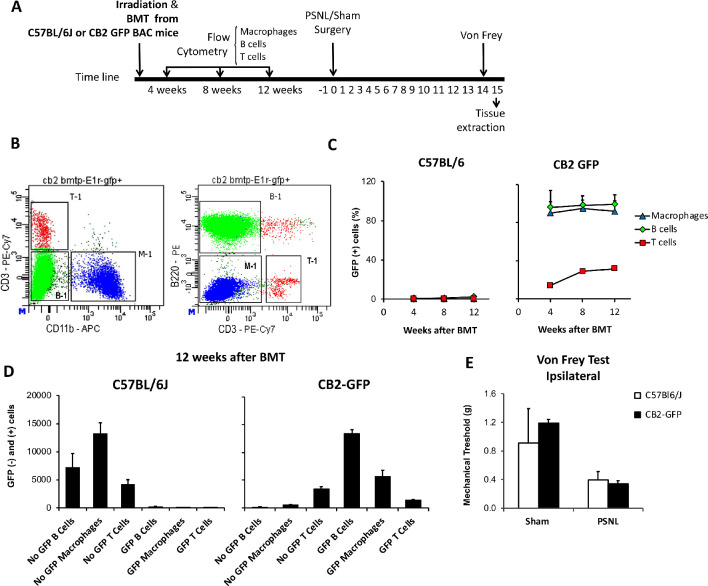
Figure 4—figure supplement 1. Bone marrow transplantation from CB2 GFP BAC to C57BL6/J mice yields mice with peripheral blood cells expressing GFP.

Figure 4—figure supplement 1.

(A) C57BL6/J mice were irradiated and immediately transplanted with bone marrow cells from CB2 GFP BAC or C57BL6/J mice, yielding CB2-GFP or C57BL6/J mice. Repeated flow cytometry assays were conducted 4, 8 and 12 weeks after the bone marrow transplantation to assess reconstitution of the immune system. Afterwards, a nerve injury or sham surgery was conducted in mice with successful reconstitution (day 0). 14 days later, mechanical nociception was assessed with the von Frey test and dorsal root ganglia samples were collected the following day. (B) Representative dot plot of flow cytometry showing the labeling of peripheral blood cells from a CB2-GFP bone marrow-transplanted mouse. Cells were pre-gated as single live cells using DAPI staining. T cells (T-1), B cells (B-1) and macrophages (M-1) were gated. PE/Cy7-labeled CD3+ T lymphocytes, APC CD11b+ myeloid cells and PE-B220-labeled B lymphocytes. (C) Percentage of GFP+ immune cells in C57Bl/6J and CB2-GFP mice from 4 to 12 weeks after transplantation. (D) 12 weeks after transplantation CB2-GFP mice showed 98% of macrophages GFP+, 86% of B cells GFP+ and 30% of T cells GFP+, whereas C57BL/6J mice did not show significant GFP signal in the different cell populations. n = 4–6 mice per group. (E) Mechanical thresholds measured before sample collection showed ipsilateral paw sensitization in C57BL/6J and CB2-GFP mice with the nerve injury. n = 2–3 mice per group. Means and error bars representing SEM are shown.
Figure 4—figure supplement 1—source data 1. Flow cytometry of blood from C57BL6/J mice transplanted with bone marrow from CB2 GFP BAC mice.
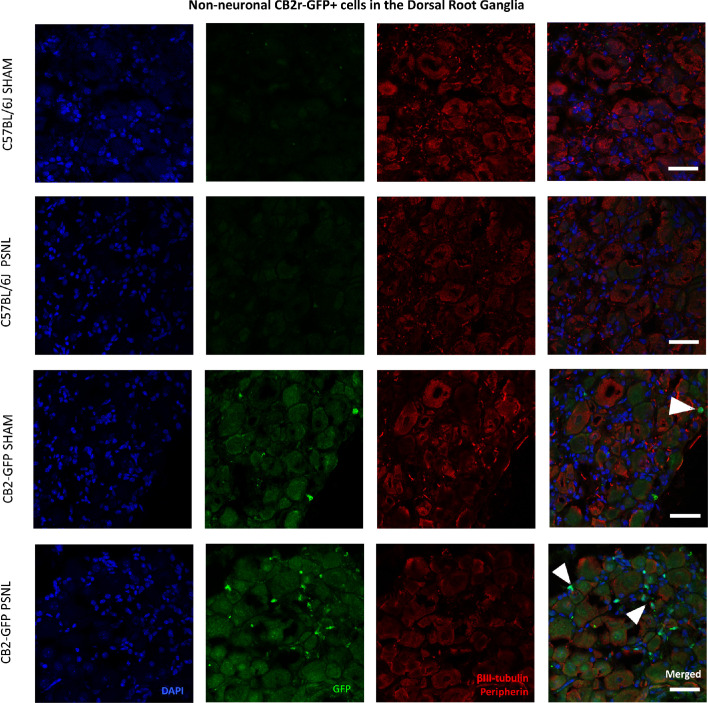
Figure 4—figure supplement 2. Non-neuronal CB2 -GFP+ cells in the Dorsal Root Ganglia.

Figure 4—figure supplement 2.

Split and merged channels of L3-L5 dorsal root ganglia images from sham or nerve-injured mice transplanted with bone marrow cells from CB2 GFP BAC mice (CB2-GFP) or C57BL6/J mice (C57BL6/J). Dorsal root ganglia sections were stained with the nuclear marker DAPI, anti-GFP, and neuronal markers anti-β-III tubulin and anti-peripherin. Sham or nerve-injured C57BL6/J mice did not show significant GFP immunorreactivity. CB2-GFP mice showed infiltration of bone-marrow=derived cells enhanced with the nerve injury. Scale bar, 45 μm. White arrows point to GFP+ cells. A certain degree of image processing has been applied equally across merged images to allow optimal visualization.
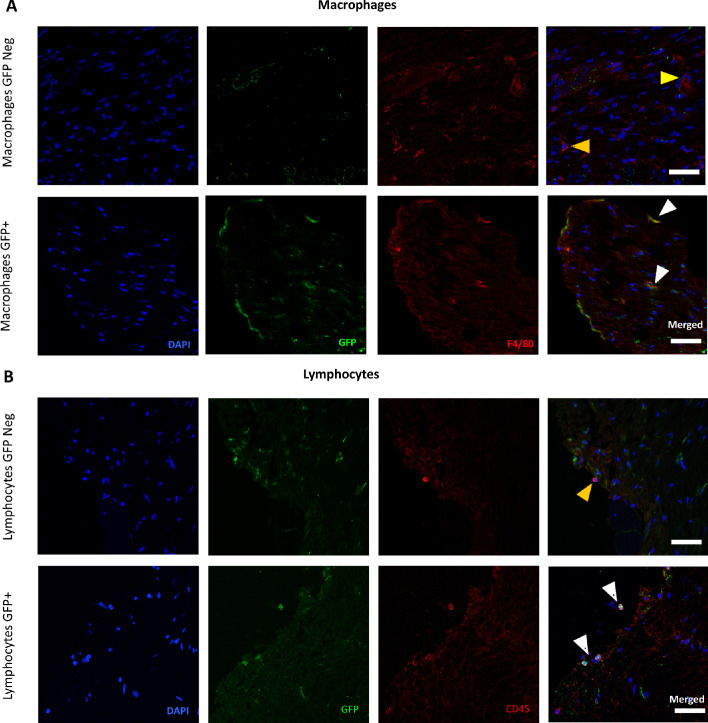
Figure 4—figure supplement 3. Presence of CB2 receptor-GFP in immune cells in the Dorsal Root Ganglia.

Figure 4—figure supplement 3.

Split and merged channels showing (A) Co-localization of CB2-GFP and the macrophage marker anti-F4/80. (B) Co-staining of anti-GFP and lymphocyte marker anti-CD45. Scale bar, 45 μm. Yellow arrows point to GFP-negative cells and white arrows to GFP+ cells. Certain degree of image processing has been applied equally across merged images for optimal visualization.
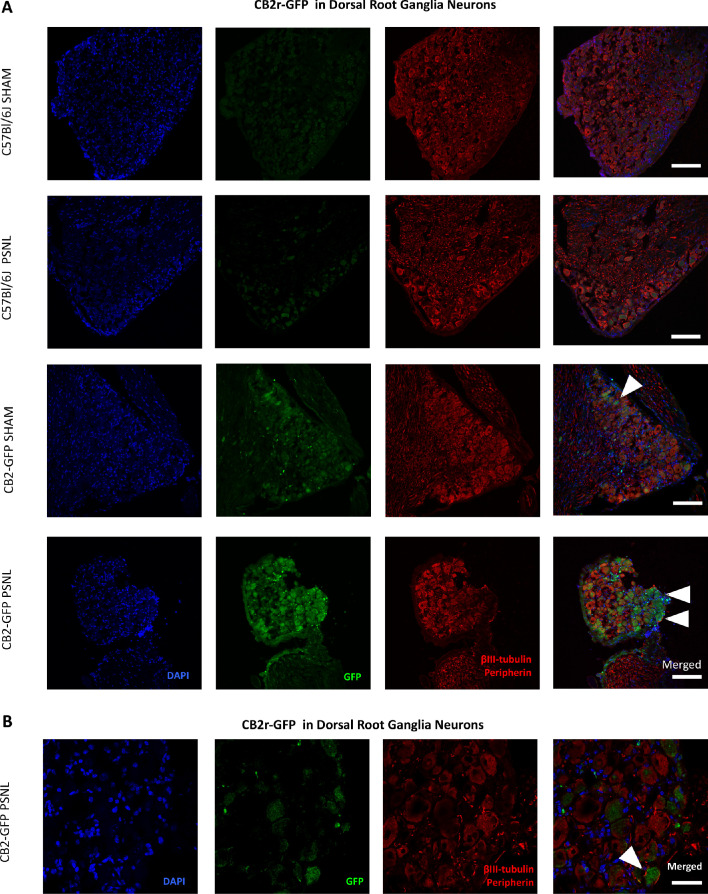
Figure 4—figure supplement 4. CB2-GFP in Dorsal Root Ganglia Neurons.

Figure 4—figure supplement 4.

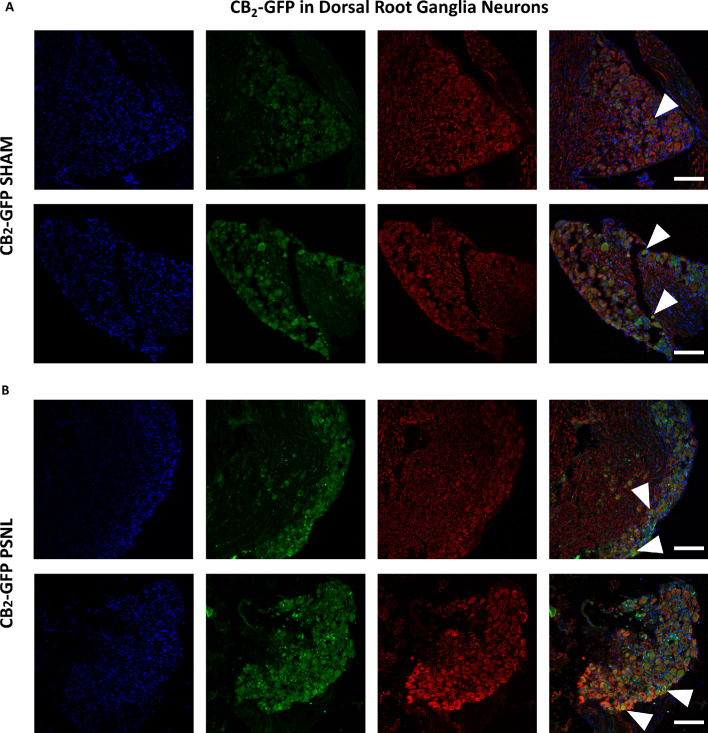
Images of L3-L5 dorsal root ganglia from sham or nerve-injured mice transplanted with bone marrow cells from CB2 GFP BAC mice (CB2-GFP) or C57BL6/J mice (C57BL6/J). (A), (B) Split and merged channels of dorsal root ganglia sections stained with the nuclear marker DAPI, anti-GFP, and neuronal markers anti-β-III tubulin and anti-peripherin. (A) Sham or nerve-injured C57BL6/J mice did not show significant GFP immunorreactivity. CB2-GFP mice showed a percentage of GFP+ neurons that was enhanced with the nerve injury. Scale bar, 140 μm. (B) Amplified section of dorsal root ganglia from CB2-GFP PSNL mice showing neuronal GFP. Scale bar, 45 μm. Certain degree of image processing has been applied equally across the merged images for optimal visualization.
Figure 4—figure supplement 5. Additional images of CB2-GFP in Dorsal Root Ganglia Neurons.

Figure 4—figure supplement 5.

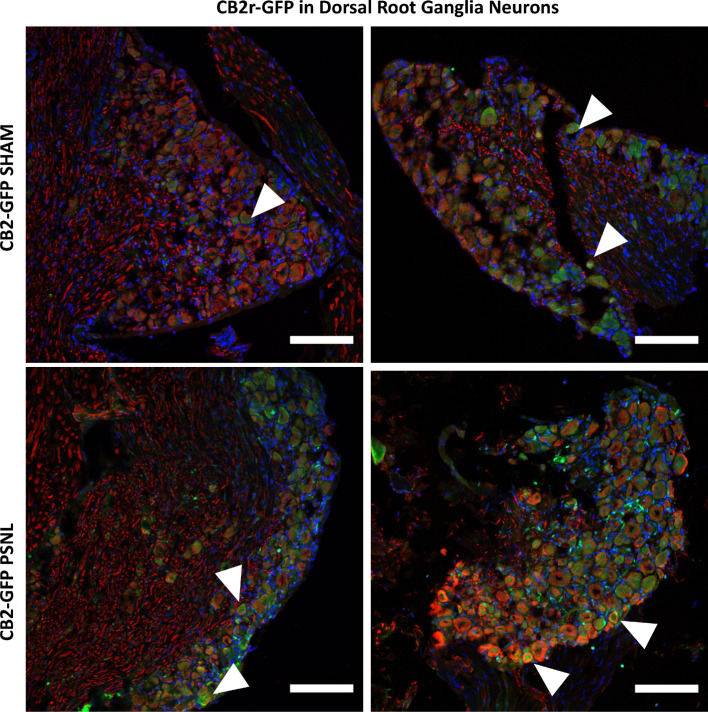
Images of dorsal root ganglia from sham or nerve-injured mice transplanted with bone marrow cells from CB2 GFP BAC mice (CB2-GFP). (A), (B) Split and merged channels of dorsal root ganglia sections stained with the nuclear marker DAPI (Blue), anti-GFP (Green), and neuronal markers anti-β-III tubulin and anti-peripherin (Red). (A) Sham C57BL6/J mice showing neuronal GFP. (B) CB2-GFP PSNL mice showing neuronal GFP. CB2-GFP mice showed higher percentage of GFP+ neurons after the nerve injury. White arrows point to GFP+ cells. Scale bar, 45 μm. Certain degree of image processing has been applied equally across the merged images for optimal visualization.
Figure 4—figure supplement 6. Higher magnification of merged images shown in Figure 4—figure supplement 5.

Figure 4—figure supplement 6.

Merged channels of dorsal root ganglia sections stained with the nuclear marker DAPI (Blue), anti-GFP (Green), and neuronal markers anti-β-III tubulin and anti-peripherin (Red). Scale bar, 45 μm. White arrows point to GFP+ cells. Scale bar, 45 μm.
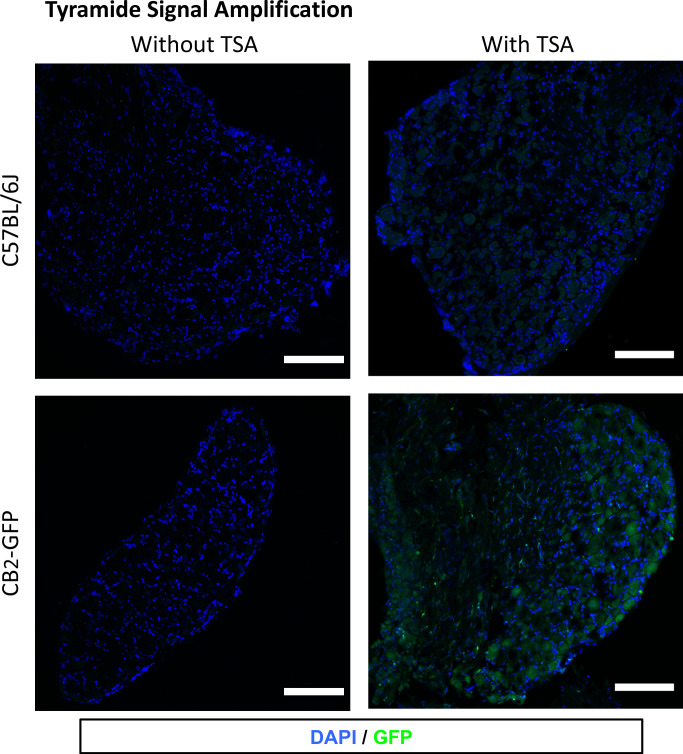
Figure 4—figure supplement 7. Tyramide signal amplification (TSA) for optimal visualization of GFP in the Dorsal Root Ganglia.

Figure 4—figure supplement 7.

Images show dorsal root ganglia sections from mice transplanted with bone marrow cells from CB2 GFP BAC mice (CB2-GFP) or C57BL6/J mice (C57BL6/J), with or without TSA. Blue, nuclear marker DAPI; Green, anti-GFP. CB2-GFP, but not C57BL6/J mice showed GFP immunorreactivity after application of TSA. Scale bar 45 μm.
Figure 4—figure supplement 8. Controls for antibody specificity in the Dorsal Root Ganglia.
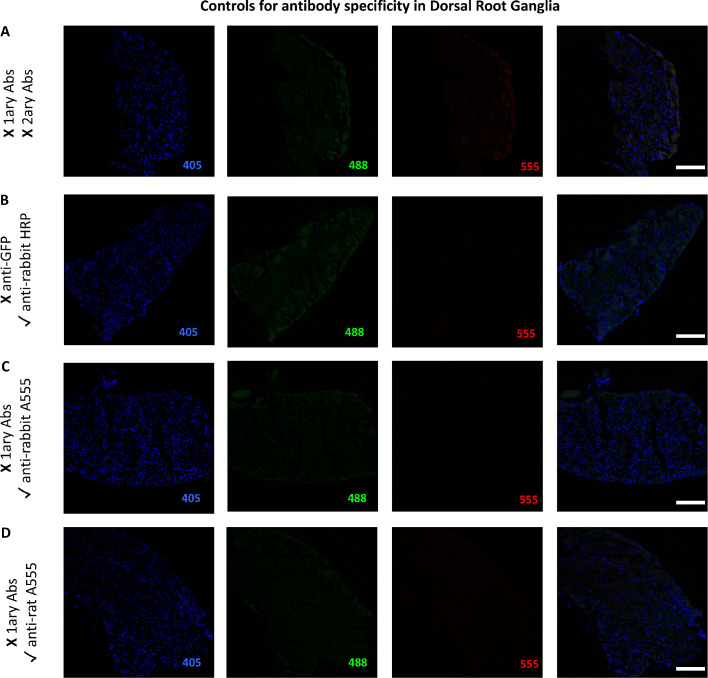
Figure 4—figure supplement 8.

The figure shows images of L3-L5 dorsal root ganglia from mice transplanted with bone marrow cells from CB2 GFP BAC mice (CB2-GFP) or C57BL6/J mice (C57BL6/J). (A) No primary or secondary antibodies control revealed no endogenous staining artifacts arising from the sample itself. (B) Anti-rabbit HRP secondary antibody without primary anti-GFP antibody. (C) Anti-rabbit A555 secondary antibody without primary rabbit antibodies. (D) Anti-rat A555 secondary antibody without primary rat antibodies. Scale bar 45 μm. A: C57BL6/J Sham. B-D: GFP Sham.