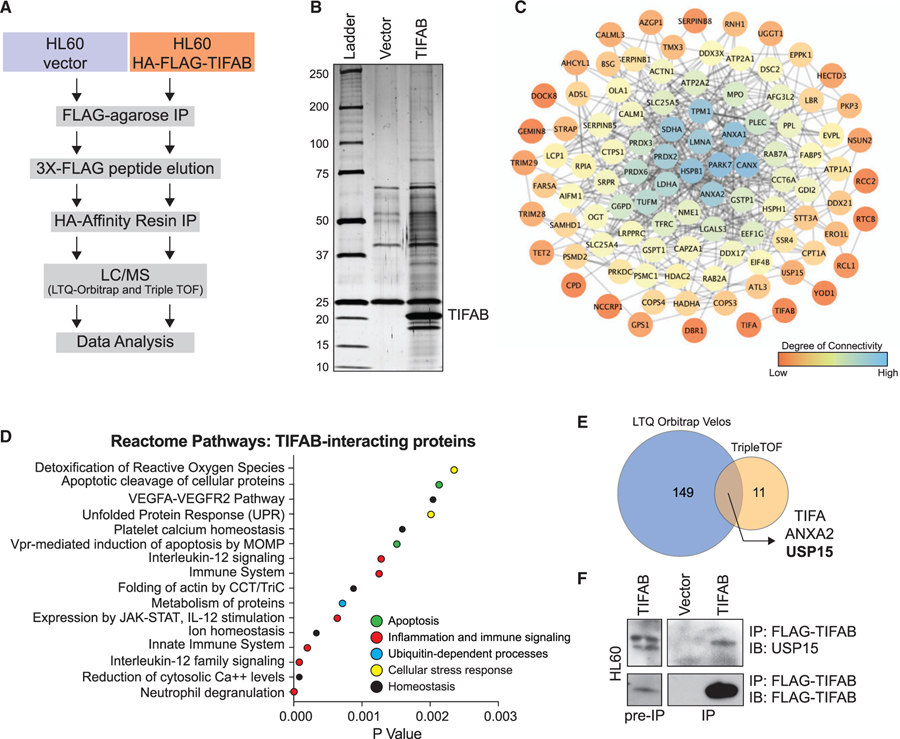
Figure 1. The TIFAB Interactome Implicates Ubiquitin Signaling Networks in Leukemic Cells.
(A) Schematic overview of workflow for identifying TIFAB-interacting proteins in a human del(5q) AML cell line.
(B) Silver-stained gel for vector-transduced protein eluate and TIFAB-transduced protein eluate from a tandem-affinity purification procedure.
(C) Interaction network for TIFAB-interacting proteins with the top 100 precursor intensity values. STRING interaction data were plotted in Cytoscape (Shannon et al., 2003), which calculates degree, a measure of connectivity (red, low; blue, high).
(D) Dot plot representing p values of statistically over-represented pathways, generated by analyzing TIFAB-interacting proteins in Reactome.
(E) Venn diagram of TIFAB-interacting proteins identified in two independent biological replicates of the proteomics screen (1A) and analyzed using two mass spectrometry (MS) approaches with varying sensitivities.
(F) Immunoblotting of endogenous USP15 on lysates immunoprecipitated for FLAG-TIFAB that were isolated from HL60 cells transduced with retrovirus encoding FLAG-TIFAB and subsequently used for MS analysis.

