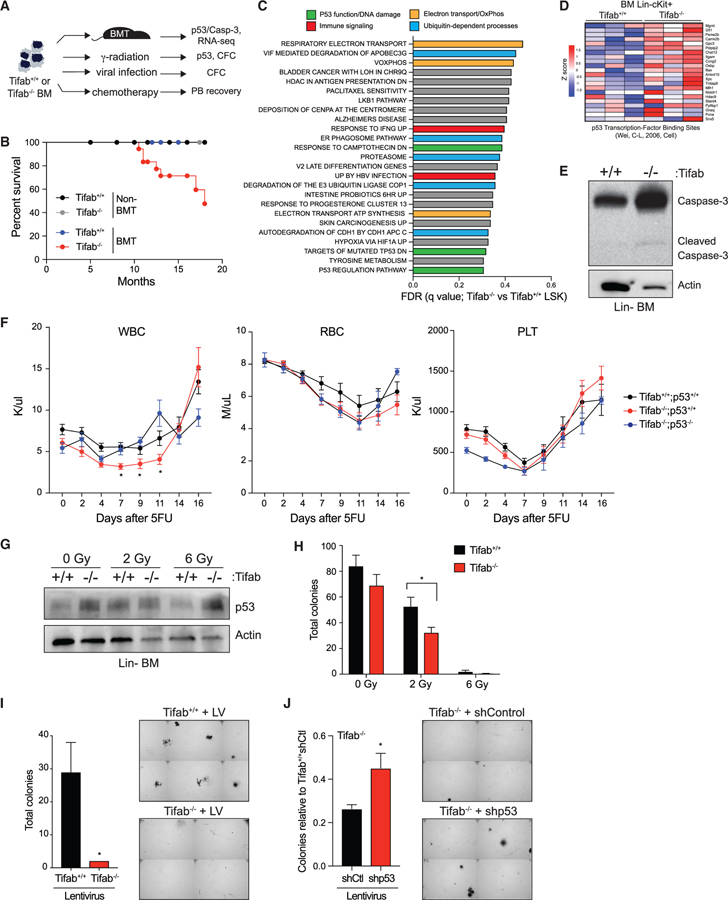
Figure 4. Loss of TIFAB Sensitizes HSPCs to p53-Dependent Stress.
(A) Overview of experimental scheme.
(B) Kaplan-Meier survival curves for nontransplanted and transplanted mice reconstituted with Tifab+/+ or Tifab−/− BM cells (four groups total). All groups except transplanted Tifab−/− exhibited 100% survival. Summary from two independent transplants analyzed for up to 16 months. A subset of the transplanted mice were previously characterized at early time points (Varney et al., 2015).
(C) Table displaying top 25 enriched pathways in TIFAB-deficient LSK cells, identified by RNA microarray and gene set enrichment analysis, with false discovery rate (FDR) <0.5. Colored pathways denote shared functions.
(D) Heatmap representing Z score values for established p53 target genes in Tifab+/+ and Tifab−/− BM LK cells (Wei et al., 2006).
(E) Immunoblotting of caspase-3 and actin on lysates isolated from BM mononuclear cells of mice reconstituted with Tifab+/+ and Tifab−/− BM cells.
(F) Peripheral blood count recovery after 5-FU injection (150 mg/kg) of mice reconstituted with BM from Tifab+/+ (n = 16), Tifab−/− (n = 16), and Tifab−/−;p53−/− (n = 5) mice. When comparing Tifab−/− and Tifab−/−;p53−/− mice, *p < 0.05.
(G) Immunoblotting of p53 in lineage-negative (Lin−) BM cells isolated from Tifab+/+ and Tifab−/− mice treated with 0, 2, or 6 Gy irradiation in vitro.
(H) Colony formation in methylcellulose of Lin− BM cells isolated from Tifab+/+ or Tifab−/− mice treated in vitro with 0, 2, or 6 Gy irradiation (n = 3). *p < 0.05.
(I) Colony formation in methylcellulose of Lin− BM cells of Tifab+/+ or Tifab−/− after infection with mCherry-expressing lentivirus (LV; pReciever-mCherry) (n = 2). A representative image is shown on the right as an image section of the entire well. *p = 0.09.
(J) Relative number of colonies of Tifab−/− Lin− BM cells transduced with vectors encoding shp53 or control shRNA (shCtl) (n = 3). Data are normalized to Tifab+/+ expressing shControl. A representative image is shown on the right as an image section of the entire well. *p = 0.08.

