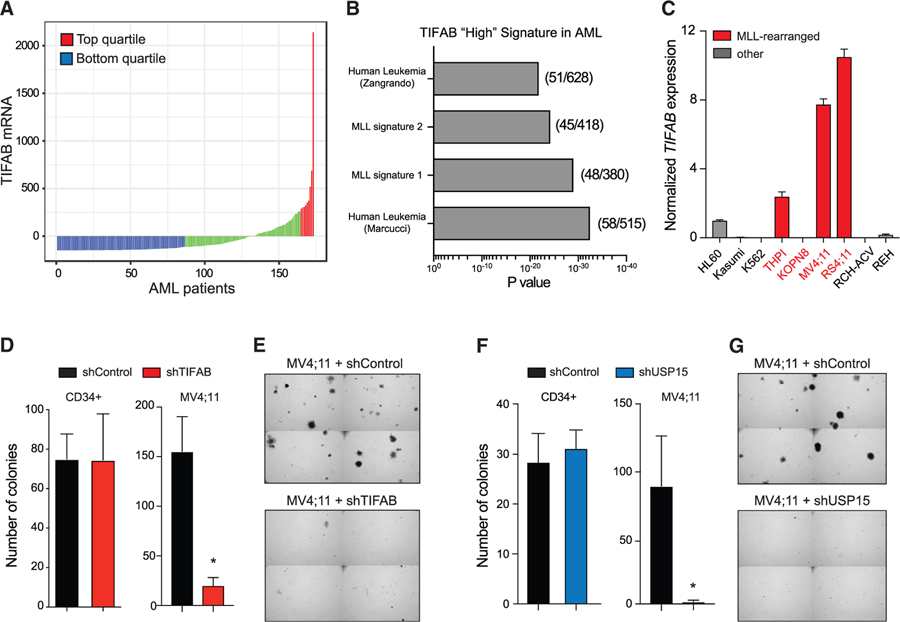
Figure 5. TIFAB Is Highly Expressed and Functionally Relevant in Human MLL-Rearranged AML.
(A) TIFAB mRNA expression in AML patients. Original TIFAB expression values (from TCGA) are normalized using the RNA-Seq by Expectation Maximization (RSEM) software. The mean values of all samples were subtracted from each sample’s RSEM count, which is depicted as “TIFAB mRNA.”
(B) Toppgene pathway analysis was performed on genes expressed in TIFAB-“high”-expressing AML patients (top quartile).
(C) Relative TIFAB mRNA expression in a panel of human leukemic cell lines normalized to HL60 cells, which are haploinsufficient for TIFAB. Red bars denote cell lines with MLL rearrangements.
(D) Colony formation in methylcellulose of CD34+ cells (left) and MV4;11 cells (right) expressing control shRNA (shControl) or shRNA targeting TIFAB (shTIFAB). *p < 0.005.
(E) Representative images of MV4;11 colonies from (D) (n = 3) as image sections of the entire well.
(F) Colony formation in methylcellulose of CD34+ cells (left) and MV4;11 cells (right) expressing control shRNA (shControl) or shRNA targeting USP15 (shUSP15). *p < 0.05.
(G) Representative images of MV4;11 colonies from (F) (n = 3) as image sections of the entire well.

