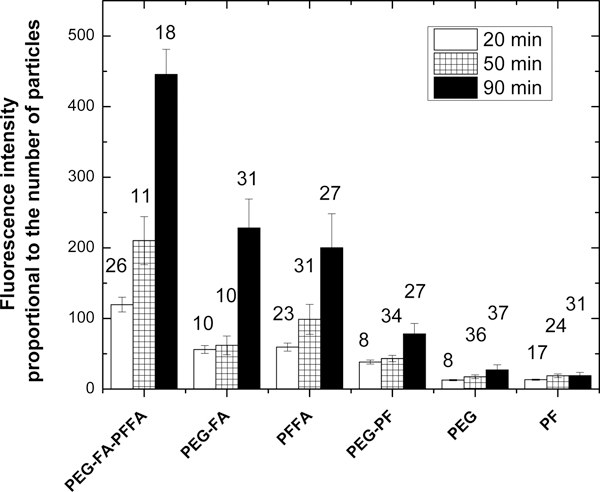
Figure 2.

Fluorescence intensity (in arbitrary units), which is proportional to the number of UFMS particles accumulated in cells after 20, 50, and 90 minutes of incubation. (Raw fluorescence intensities per unit area were divided by a coefficient shown in Table S5 to compensate for various brightness of different particle types.) The number above each column bar represents a number of analysed cells. Error bars indicate the standard deviation between different tumours in Zebrafish. The results for folate functionalized particles (SiSB-PEGFA-PFFA, SiSB-PFFA, SiSB-PEGFA) and no-folate controls (SiSB-PEG-PF, SiSB-PEG, SiSB-PF respectively) nanoparticles are shown. The experiments were repeated 3 times, three independent wells of a multiwell seeded in parallel and treated in parallel, a picture of each was acquired.
