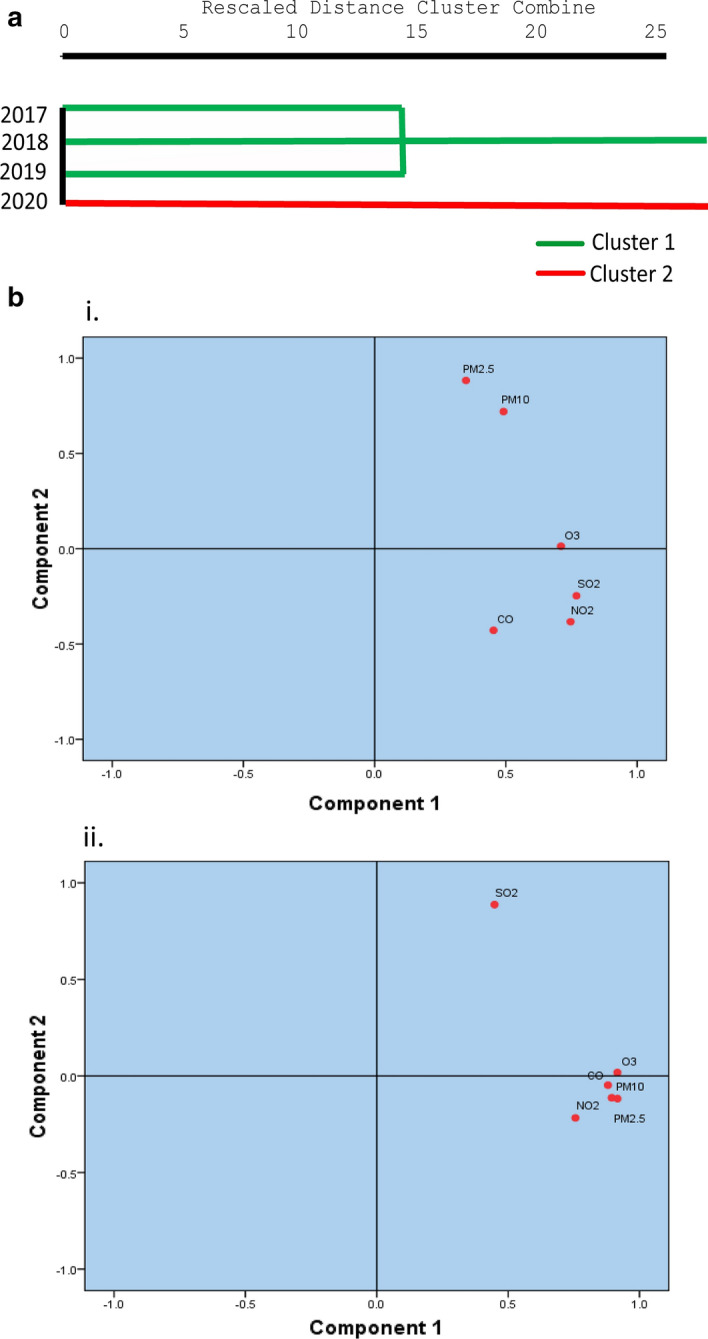
Fig. 8.

a Dendrogram portrays the variation of yearly concentration of air pollutants during and pre lockdown phase based on Hierarchical Cluster Analysis (HCA), b i Interaction and relationship among the air pollutants analysed by PCA in the year 2019, ii interaction and relationship among the air pollutants analysed by PCA in the year 2020
