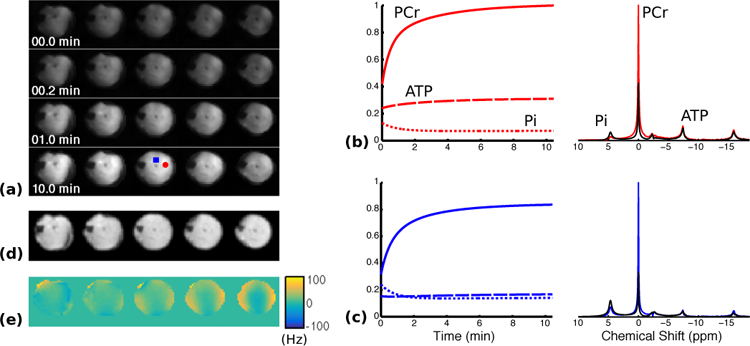
Fig. 2.

Reconstruction of dynamic MRSI data from rat hindlimb during stimulation-recovery. (a) Changes in baseline-normalized PCr concentration in the central five slices during the recovery period. (b-c) Normalized metabolite concentration curves (left) as well as selected spectra (right) from the first (black) and last (colored) time points in the reconstruction. The locations of the selected voxels are indicated by the color-coded markers (red circle and blue square, respectively) shown in the last row of (a). (d-e) Anatomical reference image and the B0 field inhomogeneity map, respectively, acquired immediately after the PCr recovery.
