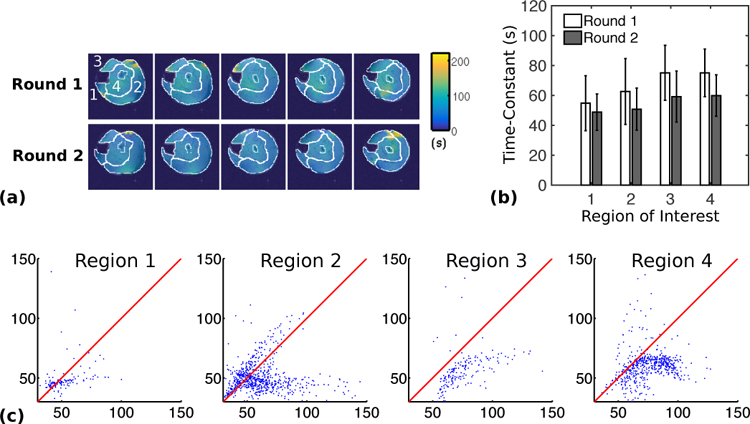
Fig. 3.

Estimated PCr resynthesis time-constant maps and regional averages from two rounds of stimulation-recovery experiments performed on the same animal with a 20 min interval between experiments. (a) Time-constant maps overlaid onto anatomical reference images from the two rounds of in vivo experiments. (b) The mean PCr resynthesis time-constants in the ROIs indicated in (a). The error bars indicate the standard deviation. All changes were statistically significant (p ≤ 0.05). The regions roughly consisted of: (1) the posterior tibialis and flexor digitorum longus, (2) the gastrocnemius, (3) the anterior tibialis and extensor digitorum longus, and (4) the soleus, peroneus, and plantaris. (c) Voxel-wise comparison of the time constants from the two rounds. Horizontal and vertical axes in the correlation plots show the time constants from the first and second rounds, respectively. The red line in each plot indicates the line of identity.
