
Figure 6.
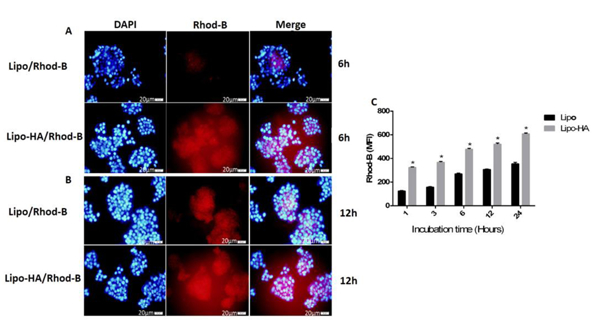
Fluorescence microscopy images of HEPG2 (CD44low expressed) cancer cells treated with lipo/RhoB and lipo-HA/RhoB nanoparticles (with 1μM concentration of RhoB in each preparation) showing the cellular uptake at 6 and 12 h incubation times (A-B). Uptake of lipo/RhoB and lipo-HA/RhoB nanoparticles measured by flow cytometry (C). Blue and red fluorescence are related to the DAPI and RhoB respectively (magnification 40x). The data of each group compared to lipo/RhodB. Data represent mean±SD (n=3). MFI: Mean fluorescence intensity.