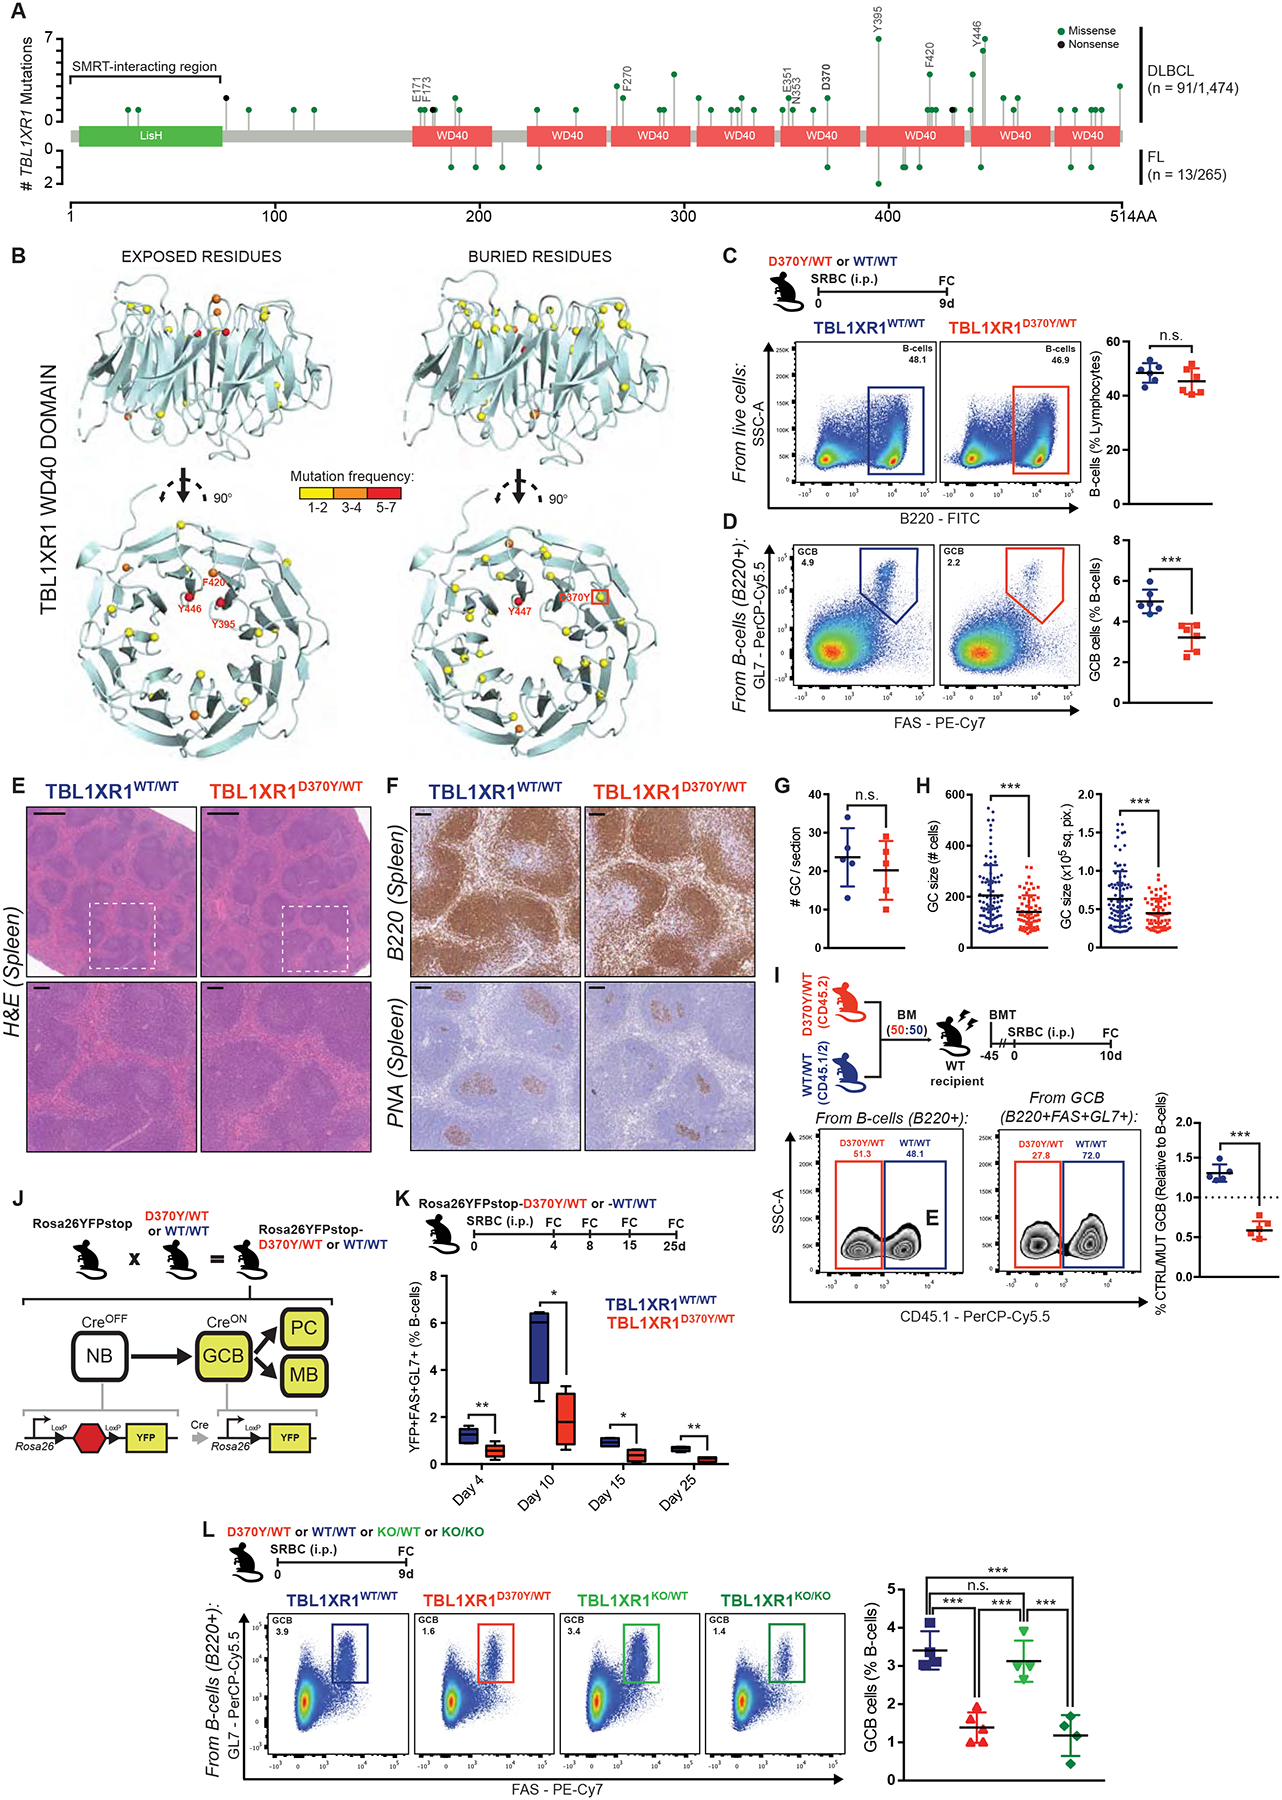
Figure 1. Tbl1xr1 mutation impairs GC development.

A, TBL1XR1 mutations in DLBCL (Arthur et al., 2018; Ma et al., 2019; Reddy et al., 2017) and FL (Krysiak et al., 2017; Ma et al., 2019; Ortega-Molina et al., 2015). TBL1XR1-SMRT interacting region (Zhang et al., 2002), and PPI mutated positions are indicated. See also Data S1A–C and Table S1.
B, Exposed (>25% accessible surface) or buried residues affected by missense DLBCL mutations in TBL1XR1 WD40 domain (4LG9; DOI: 10.2210/pdb4lg9/pdb).
C-D, FC analysis of splenic (C) total B-cells or (D) GCB. See also Data S1D–F.
E, Spleen sections H&E from animals treated as in C. Insets show zoom of outlined areas. Scale = 500μm (top), 100μm (bottom).
F, B220 or PNA IHC in consecutive spleen sections from E. Scale = 100μm.
G-H, (G) Number of GC per spleen section or (H) GC size as (left) number of cells or (right) area, based on PNA staining. Dots represent individual (G) animals or (H) GCs. Results for 5 animals per genotype.
I, FC analysis of D370Y/WT and WT/WT relative contribution to total B-cells and GCB, based on CD45 allelic frequencies. See also Data S1H–J.
J, Use of the Rosa26YFPstop reporter.
K, FC analysis of splenic GCB. Left to right: n = 4, 5, 5, 4 per genotype. See also Data S1K–L.
L, FC analysis of splenic GCB.
Values represent mean ± SEM. Data reproducible with three repeats. NS, not significant; *P < 0.05; **P < 0.01; ***P < 0.001, using unpaired (C,D,K) or paired (I) two-tailed Student’s t-test; or Mann-Whitney U-test (G,H); or one-way ANOVA with Tukey’s post-test (L).
