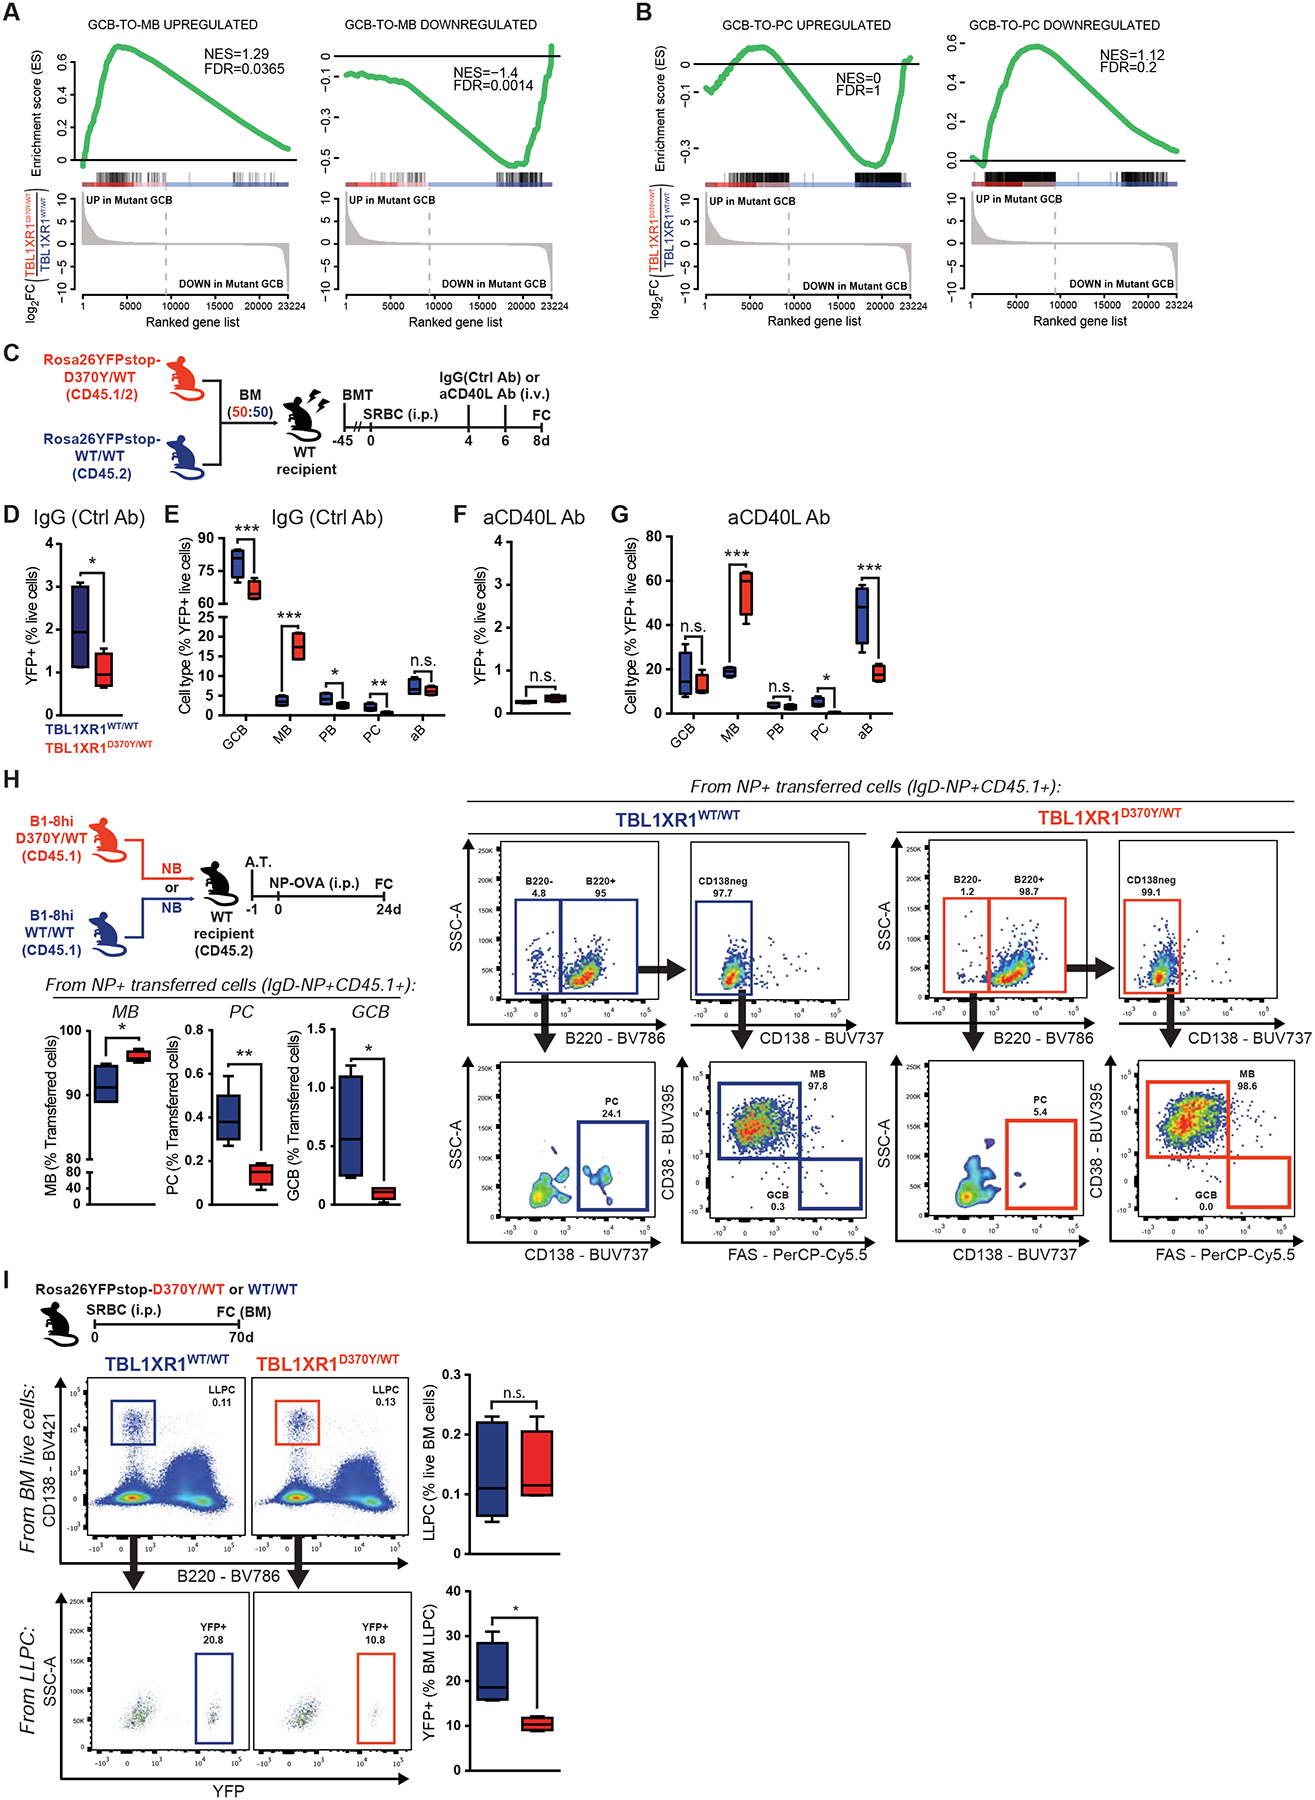
Figure 4. Tbl1xr1 mutations bias cell fate towards MB.

A-B, GSEA of antigen-specific (A) MB or (B) PC, relative to GCB (GSE4142), against D370Y/WT GCB.
C, Experimental scheme and timeline for D-G.
D-E, FC analysis of (D) total YFP+ splenocytes in IgG(Ctrl Ab) treated mice, and (E) the relative cell type composition of this population. Results for 4 animals. See also Figure S4C and Data S1U.
F-G, FC analysis of (F) total YFP+ splenocytes in anti-CD40L treated mice, and (G) the relative cell type composition of this population. Results for 4 animals.
H, FC analysis of cell type composition of antigen-specific splenocytes. Results for 5 animals. See also Data S1V.
I, FC analysis of (top) total or (bottom) GC-derived BM LLPC.
Values represent mean ± SEM. Data reproducible with two repeats. P-values calculated using unpaired (H,I) or paired (D-G) two-tailed Student’s t-test.
