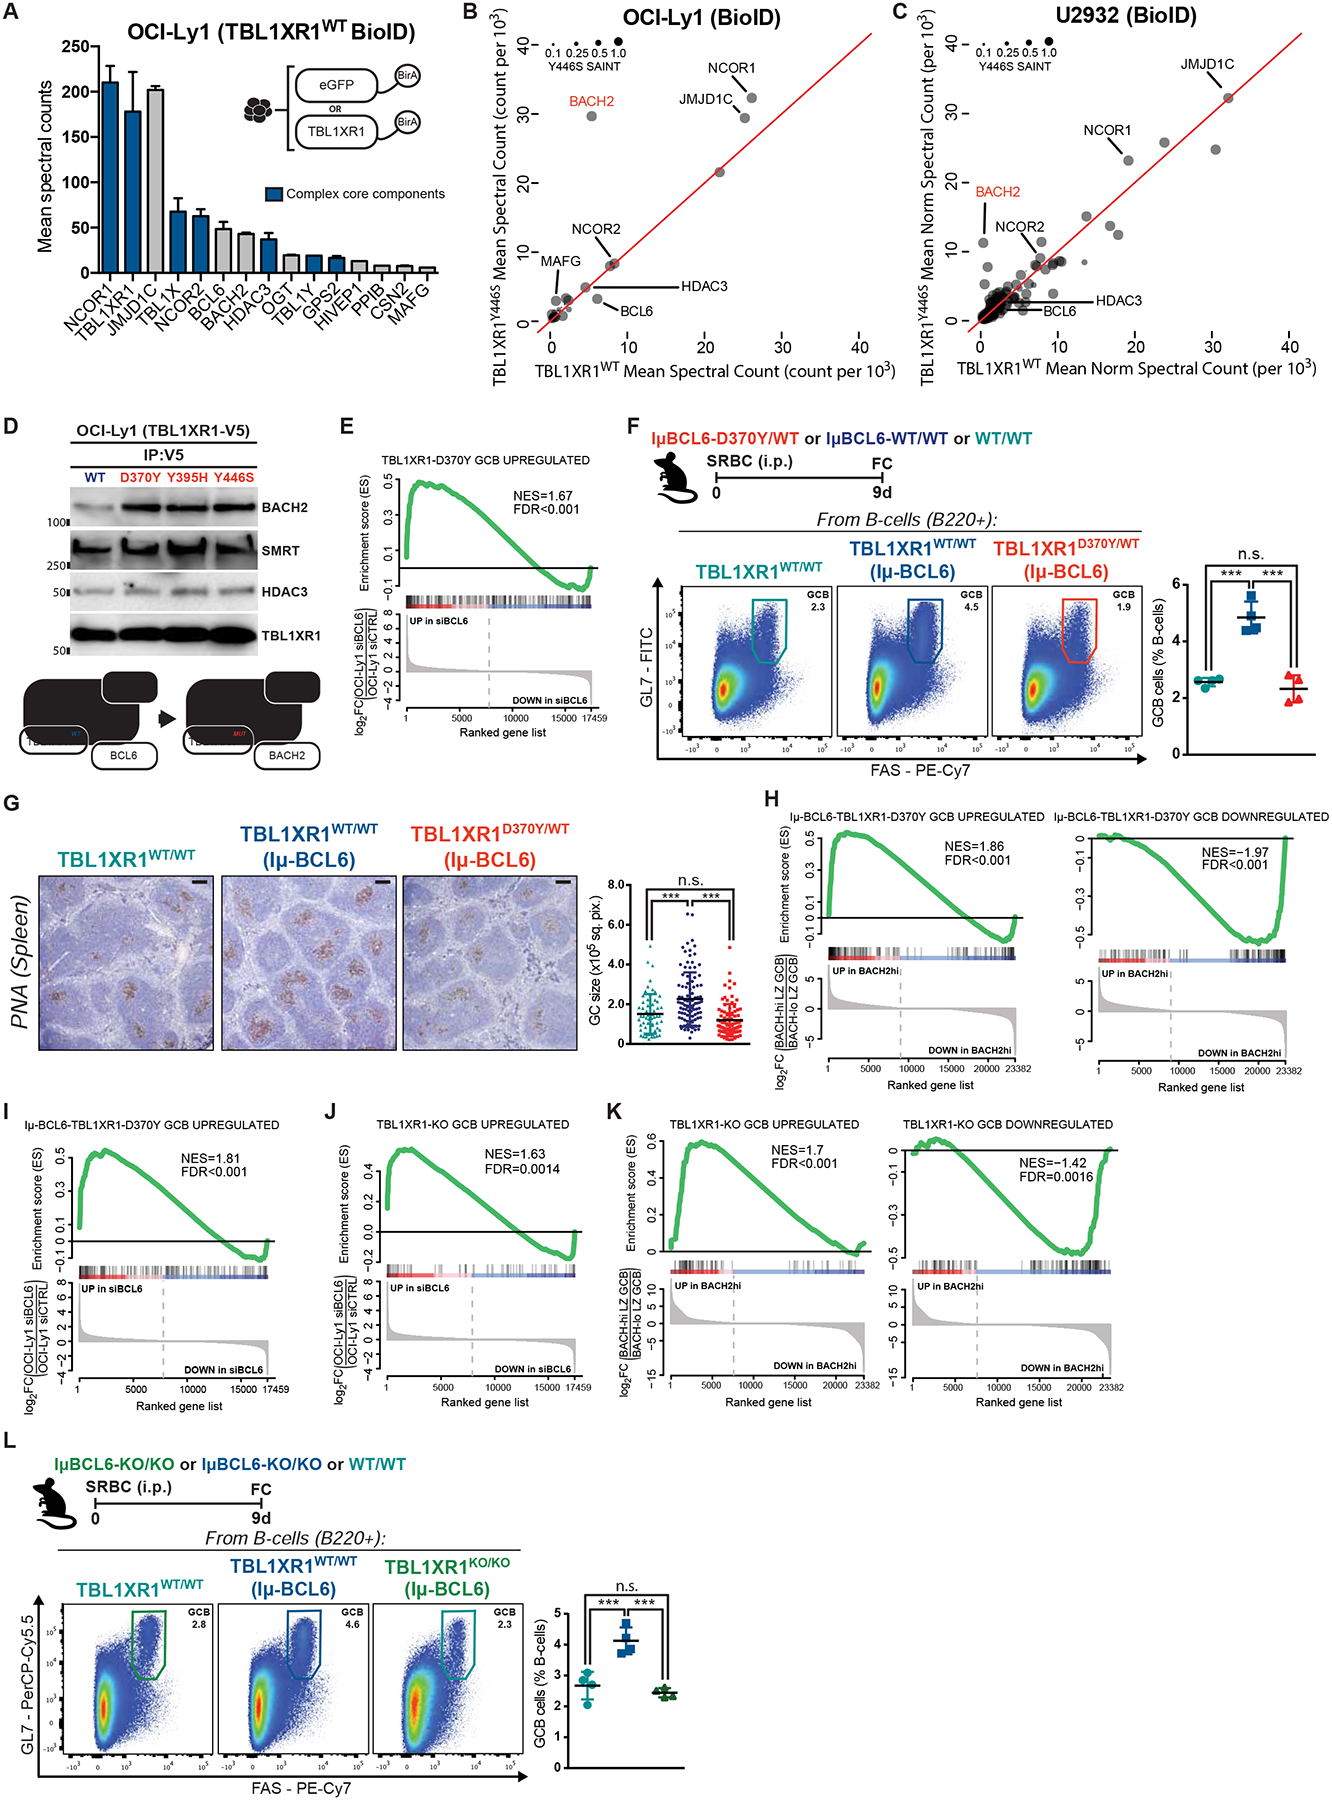
Figure 5. TBL1XR1 mutations introduce a BCL6-to-BACH2 switch.

A, TBL1XR1WT interacting proteins. Shown are hits with SAINT>0.75 and 2-fold spectral counts (averaged between biological duplicates) over eGFP-BirA. See also Figure S5C and Table S3.
B-C, Comparison between TBL1XR1 WT and Y446S BioID. Results as average of biological duplicates for each condition.
D, Co-IP results for V5 pulldown in cells inducibly expressing WT or mutant TBL1XR1-V5 fusion proteins. See also Figures S5D–E.
E, GSEA of D370Y/WT GCB against siBCL6-treated OCI-Ly1 (GSE29282).
F, FC analysis of splenic GCB. See also Data S1W.
G, IHC staining of spleen sections from F. Graph shows GC area based on PNA staining. Dots are individual GCs. Results for 4 animals per genotype. Scale = 100μm.
H-I, GSEA of IμBcl6-Tbl1xr1D370Y/WT GCB against (H) BACH2hi GCB (GSE77319) or (I) siBCL6-treated OCI-Ly1.
J-K, GSEA of KO/KO GCB against (J) siBCL6-treated OCI-Ly1 or (K) BACH2hi GCB.
L, FC analysis of splenic GCB.
Values represent mean ± SEM. Data reproducible with two repeats. P-values calculated using one-way ANOVA with Tukey’s post-test (F,L), or Kruskal–Wallis H test with Dunn’s post-test (G).
