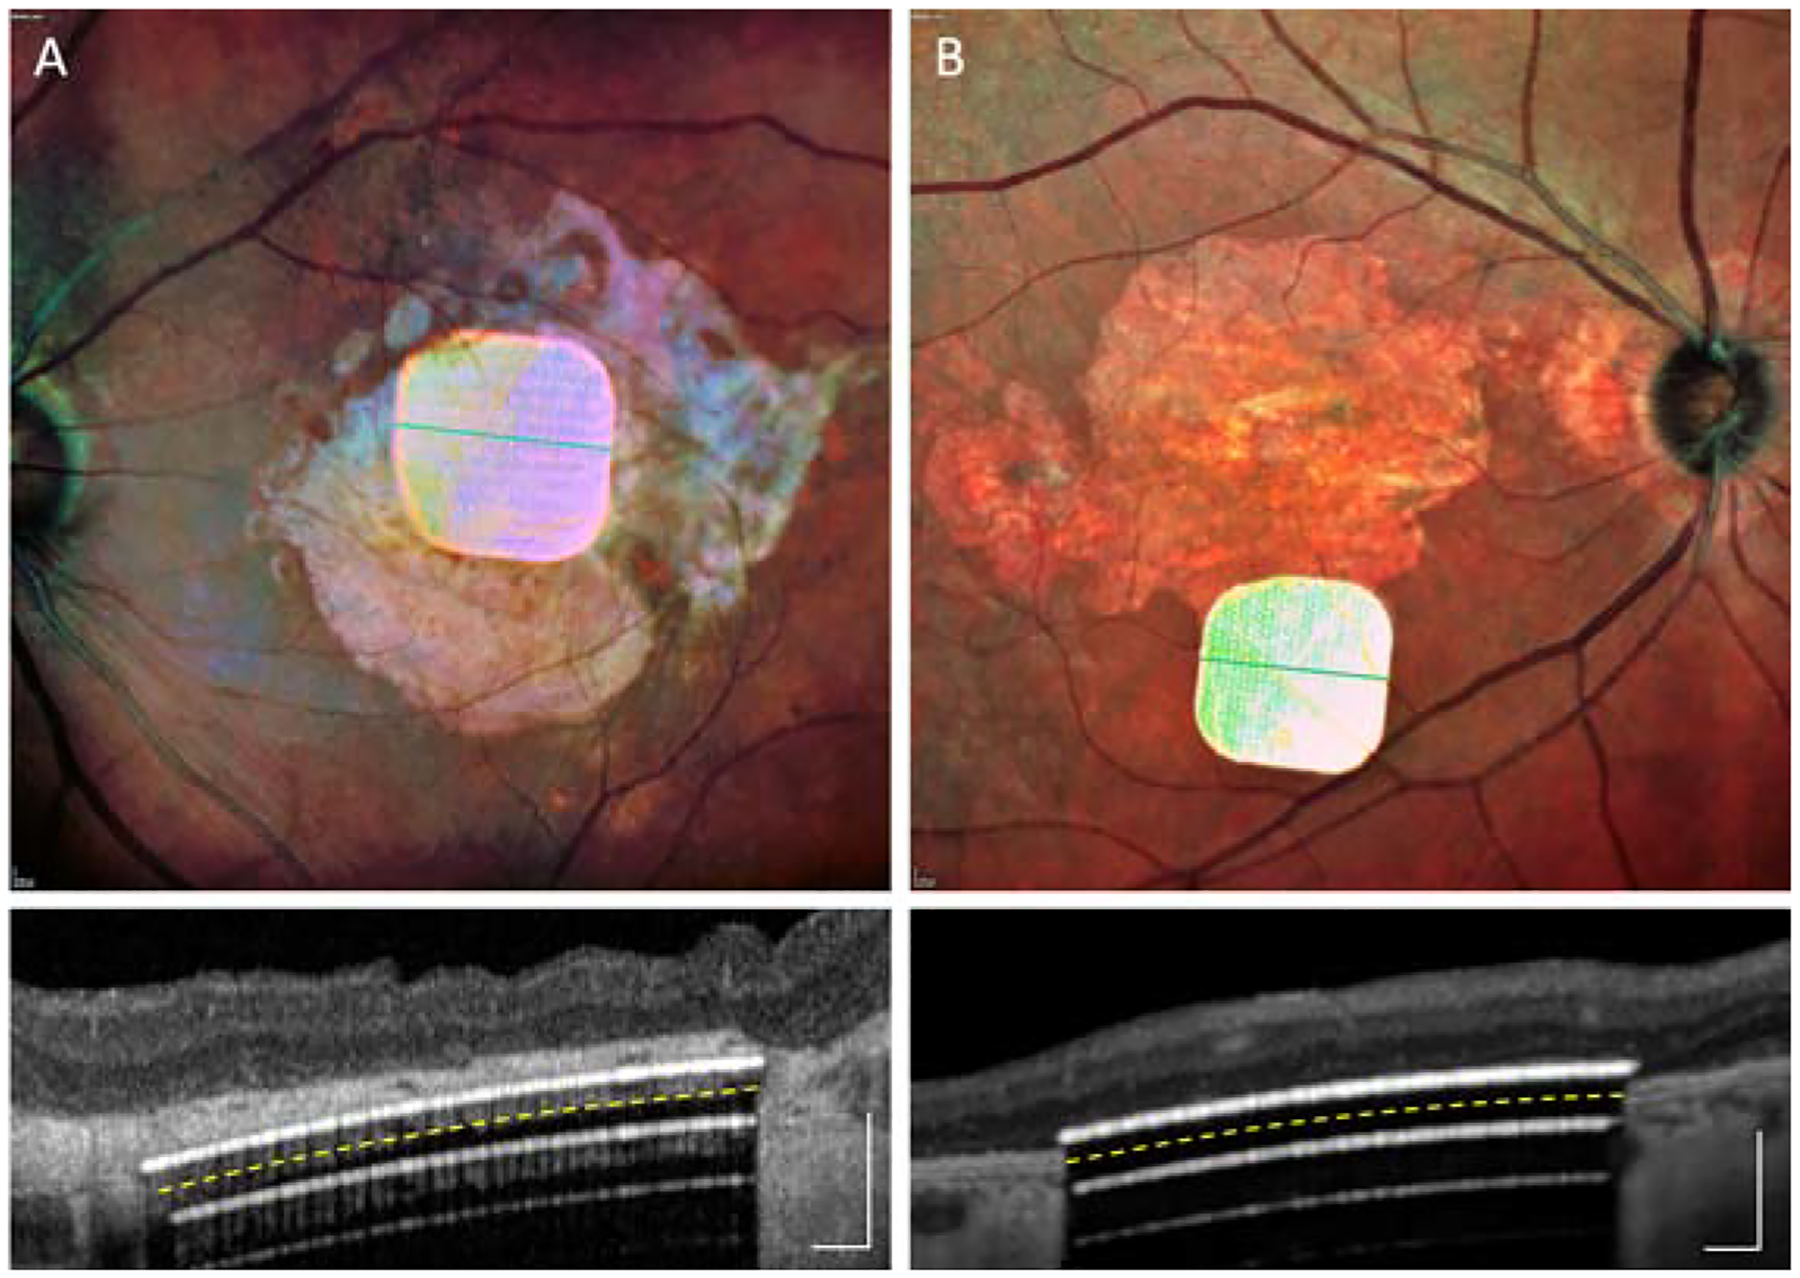
Figure 2.

Fundus photos and OCTs taken along the green line, with two implants in unintended locations: (A) in the choroid in patient #1; (B) in the periphery of the macula in patient #4. Scale bars are 200 μm. Yellow dash line indicates the back side of the implant. White lines underneath the implant are the OCT reflections. Images obtained during the 6-weeks to 6-months post-op visits.
